
Fig. 3.
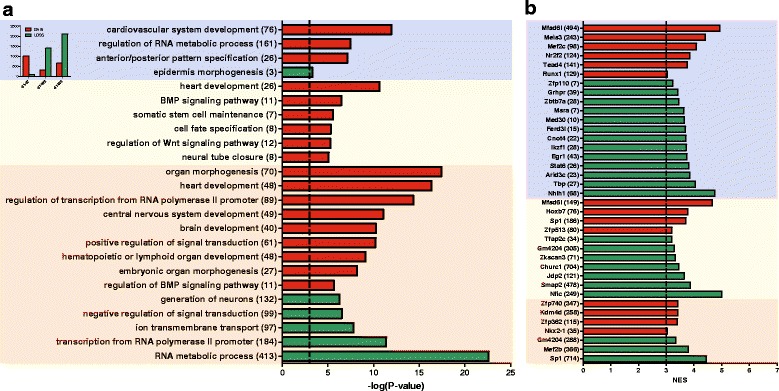
Ontology analysis of genes mapped to genomic regions differentially methylated during development of murine heart. a Ontological terms associated with the genes overrepresented among the genes mapped to the DMRs between d1 and d7 (blue), d1 and w2 (yellow), and d1 and w8 (red). Gene set enrichment analyses were performed and gene ontology annotations were found with ClueGo. The results are presented as -log(P-value). All presented p-values were lower than 0.05. The numbers of corresponding DMRs are shown in the inset. b Transcription factor binding sites enriched for the genes associated with the DMRs between d1 and d7 (blue), d1 and w2 (yellow), and d1 and w8 (red). The analysis was carried out with iRegulon. The results are presented as Normalized Enrichment Scores (NES). The numbers of genes associated with the listed terms/transcription factors are shown in parentheses