
Fig. 6.
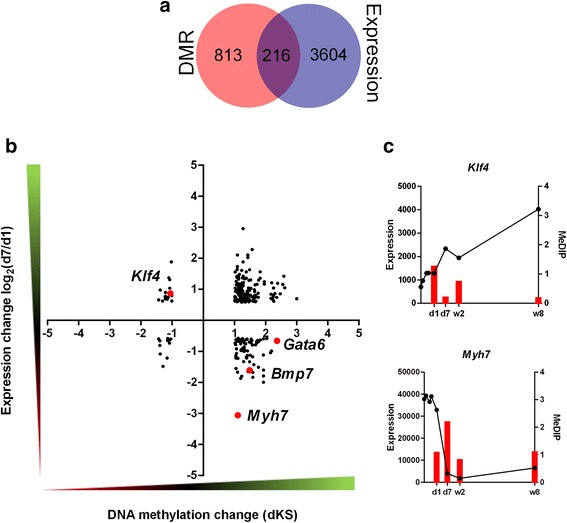
DNA methylation and gene expression changes in neonatal murine hearts between d1 and d7. a The number of genes associated with the DMRs between d1 and d7 and those showing at least a 1.5-fold change in expression between these time-points (b) Dot plot representation (c) and representative examples of genes changing the expression and DNA methylation status between d1 and d7. The numbers of dots representing the genes are listed in Table 3. The complete lists of genes are included in Additional file 1: F1