Fig. 1.

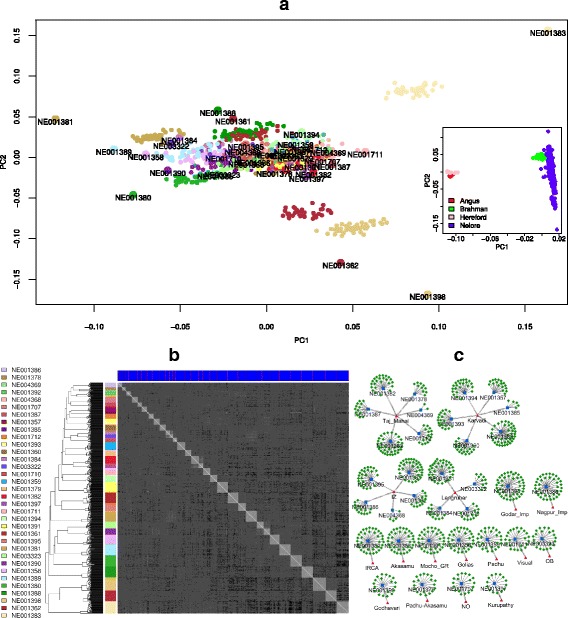
Genetic profiling using the Genomic Relationship Matrix. a PCA analysis of all 780 Nelore (families differentiated by colors, sires are labeled). Inset shows a PCA with other breeds from Hapmap. b Heatmap and hierarchical clustering of the 780 Nelore. Lateral palette colors represent the families (same color correspondence to (a); upper color palette differentiates sires (red) from sibs (blue); shades of grey from the heatmap represent relationship similarities (darker is less related). c Pedigree view of the families showing the sires (blue), sibs (green) and the lineage ancestral from father side (red)
