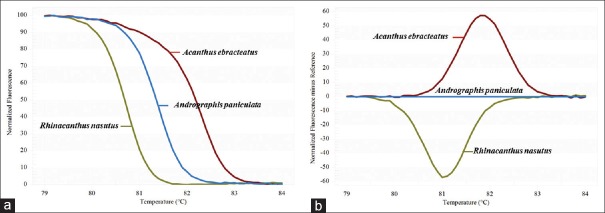
Figure 2.
Barcoding of three species tested using high resolution melting analysis with the designed rbcL chloroplast marker. (a) Difference graph of the three species using Andrographis paniculata as reference. (b) Melting curves of the rbcL amplicons from the three species using Andrographis paniculata as reference. Color code box with the species used

