Figure 6.
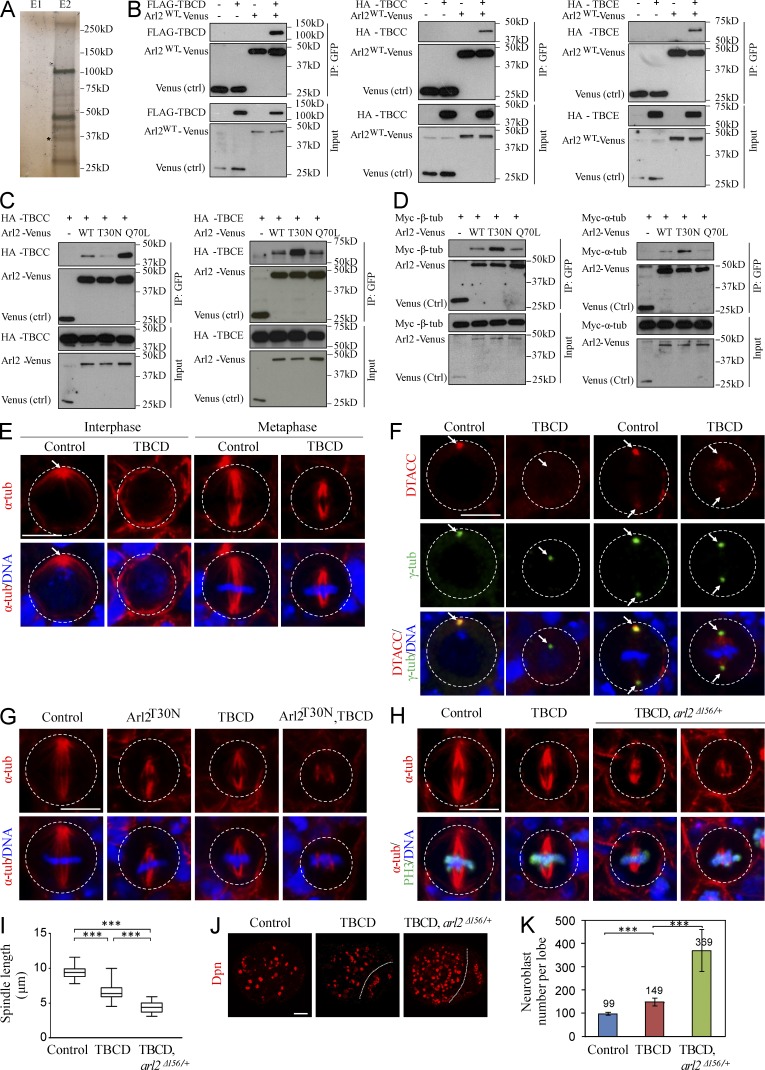
Arl2 functions together with TBCD to regulate microtubule growth and D-TACC/Msps localization. (A) Silver staining of Elution fractions E1 and E2 after TAP. E2 sample contains most of the proteins associated with Arl2-CTAP. Asterisk indicates the bait protein. (B) Coimmunoprecipitation (IP) of Arl2WT-Venus and FLAG-TBCD, HA-TBCC or HA-TBCE. (C) Coimmunoprecipitation of different forms of Arl2-Venus and HA-TBCC or HA-TBCE. (D) Coimmunoprecipitation of different forms of Arl2-Venus and Myc–β-tubulin or Myc–α-tubulin. (E) NBs of control and TBCD overexpression labeled with α-tubulin and DNA. (F) NBs of control and TBCD overexpression labeled for D-TACC, γ-tubulin, and DNA. Arrows indicate the centrosomes. (G) Metaphase NBs of control, Arl2T30N, TBCD, and Arl2T30N, TBCD coexpression labeled with α-tubulin and DNA. (H) Metaphase NBs of control, TBCD overexpression, and TBCD overexpression in heterozygous arl2Δ156 background (arl2Δ156/+) labeled for α-tubulin, PH3 and DNA. (E–H) The white dotted circles label the cell outlines. (I) Quantification of spindle length (with SD) in H. Control: 9.48 ± 0.91 µm (n = 16); TBCD: 6.61 ± 1.23 µm (n = 15); TBCD, arl2Δ156/+: 4.41 ± 0.82 µm (n = 15). ***, P < 0.001. (J) Larval brains of control, TBCD overexpression, and TBCD overexpression in heterozygous arl2Δ156 background stained with Dpn. Central brain is to the left of the white dotted line. (K) Quantification of NB number per brain hemisphere (with SD) in J. Control: 99 ± 5 (n = 20); TBCD: 149 ± 17 (n = 18); TBCD, arl2Δ156/+: 369 ± 90 (n = 13). ***, P < 0.001. Bars: (E–H) 5 µm; (J) 20 µm.

