Figure 3.
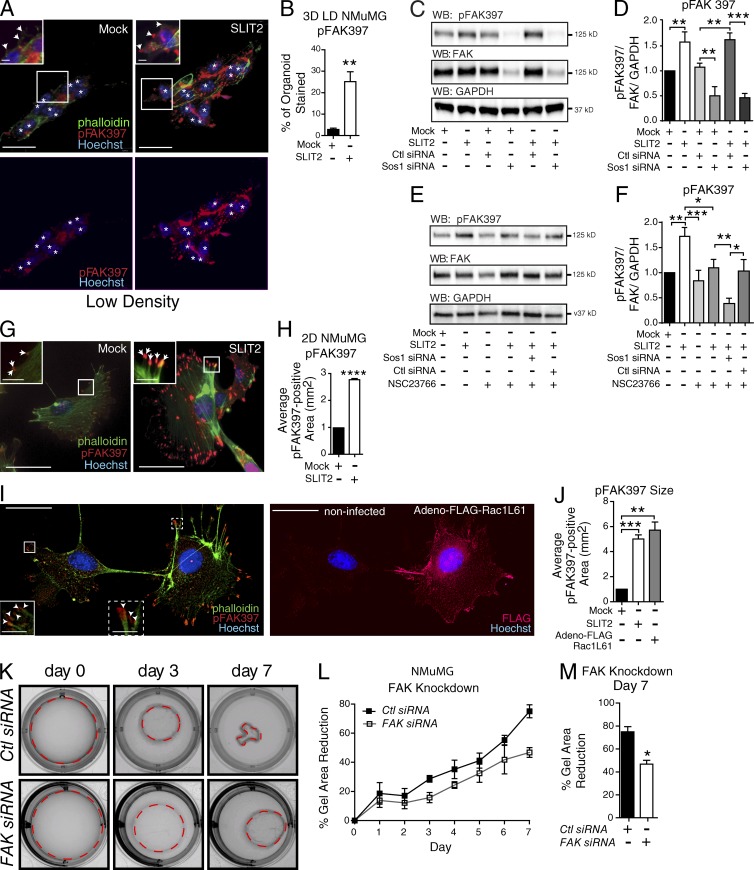
SLIT2/ROBO1/Rac signaling increases pFAK397 in CMAs. (A) Representative images of NMuMG cells in LD 3D collagen gels after Mock or SLIT2 treatment and stained for pFAK397 (red), phalloidin (green), and Hoechst (blue). White asterisks indicate nuclei. Arrowheads point to CMAs. (B) Mean percentage of the organoid (3+ nuclei) stained for pFAK397 (n = 12+ organoids). (C and E) Representative blots of pFAK397, total FAK, and GAPDH from NMuMG cells treated with Mock or SLIT2 and indicated siRNA and Rac Inhibitor, NSC. (D and F) Quantification of pFAK normalized to total FAK and GAPDH (n = 3 experiments). (G) NMuMG cells treated with Mock or SLIT2 and immunostained for pFAK397 (red), phalloidin (green), and Hoechst (blue). Arrows point to CMAs. (H) Quantification of pFAK397-labeled puncta (n = 3 experiments). (I, left) Representative images of NMuMG cells stained for pFAK397 (red), phalloidin (green), and Hoechst (blue); on right, FLAG (red). (inset left) Magnified images of boxed regions with arrowheads pointing to CMAs. (J) Quantification of pFAK397-labeled puncta (n = 3 experiments). (K) Representative images of 3D LD gels embedded with NMuMG cells transfected with control or FAK siRNA. (L and M) Quantification of K showing percentage reduction in collagen gel area (n = 3 experiments). Bars, 30 µm. Black asterisks denote significance by t test: *, P < 0.05; **, P < 0.01; ***, P < 0.001; ****, P < 0.0001.

