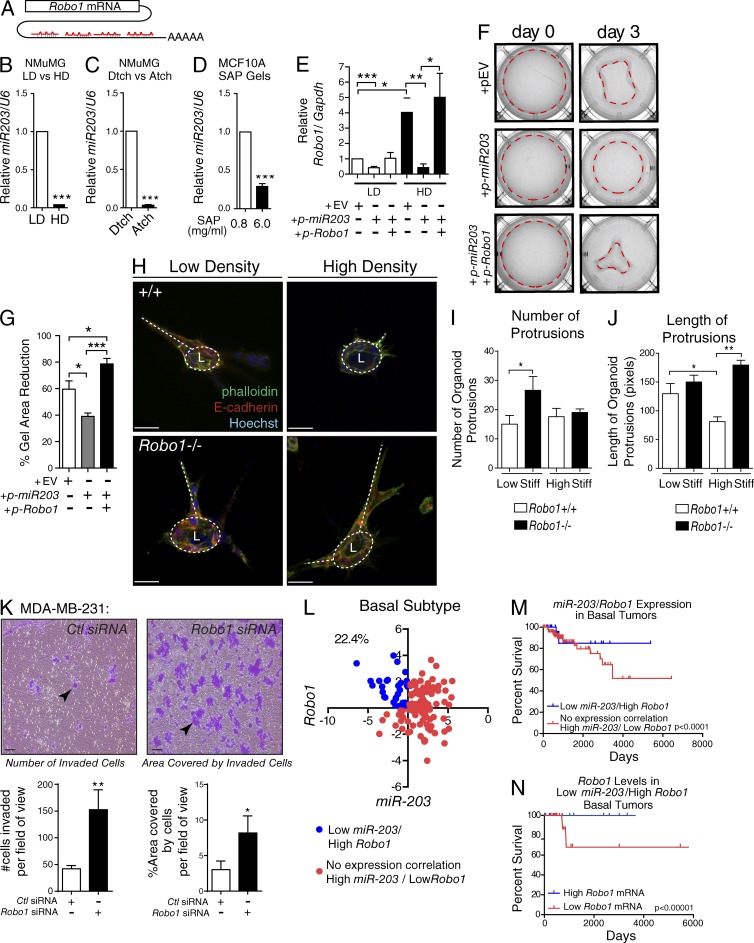
Figure 6.
ECM stiffness inhibits miR-203 expression and elevates Robo1 expression to regulate mammary cell contraction and organoid morphology and is associated with improved survival. (A) Cartoon of four miR-203 binding sites on Robo1’s 3′UTR. (B–D) MiR-203 expression analyzed from NMuMG cells cultured in LD or HD (B), LD detached (Dtch) or attached (Atch; C), or 3D SAP gels (D; n = 3 experiments). (E) Robo1 expression analyzed from NMuMG cells transfected with an empty vector (EV), a vector overexpressing premiR-203, or a vector overexpressing Robo1 without a 3′UTR then cultured in LD or HD gels for 3 d (n = 3 experiments). (F) Representative images of LD gels from E, with dashed line encircling the gel area. (G) Quantification of the percent reduction in the gel area (n = 3 experiments). (H) Representative z-stack projections of MECs cultured in LD and HD collagen gels and stained for E-cadherin (red), phalloidin (green), and Hoechst (blue). Circular dashed lines mark lumens (L), and base of protrusions are traced by dashed lines. (I–J) Quantification of number (I) and length of protrusions (J) per organoid (n = 3 experiments). (K) Invasion assay using MDA–MB-231 cells. Arrowheads point to clusters of migrated cells (L) Scatterplot expression analysis of basal subtype breast tumors with low miR-203 + high Robo1 expressing samples indicated as blue dots and all other samples indicated as red dots. Percentage represents the proportion of samples: (low miR-203 + high Robo1 expressing tumors)/(total basal tumor; 22.4%; n = 142). (M) Survival curve analysis of indicated populations from K (n = 142). (N) Survival curve analysis of bottom and top 25% Robo1 expressing basal tumor samples with Low miR-203 + High Robo1 expression (n = 30). Bars: (H) 30 µm; (K) 100 µm. Asterisks denote significance using t test: *, P < 0.05; **, P < 0.01; ***, P < 0.001. Survival curve p-values determined using Renyi analysis, with weighted values of P = 0 and q = 1 optimized for long-term survival. Stiff, stiffness.

