Figure 1.
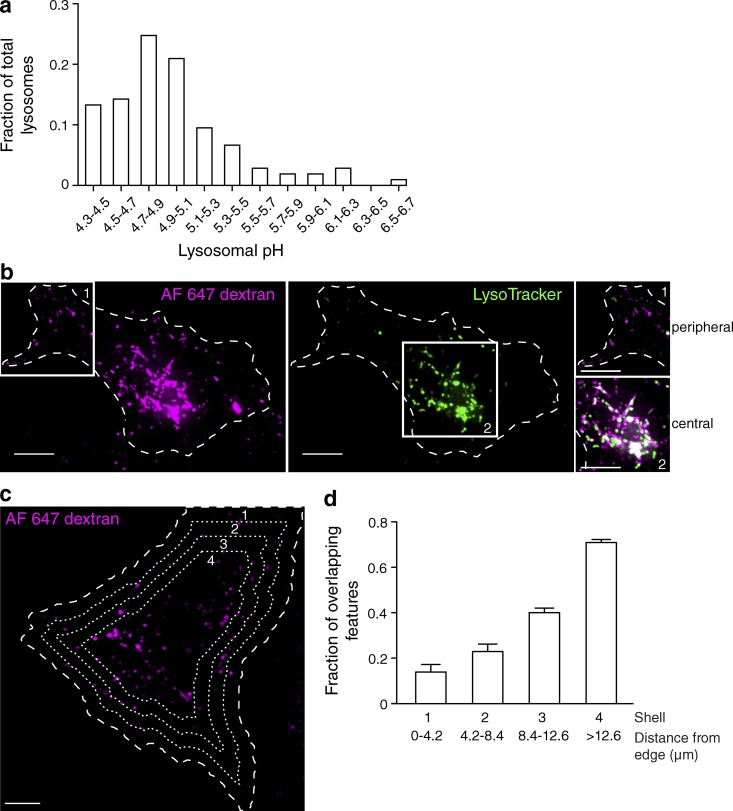
Lysosomal pH is heterogeneous. (a) The lysosomes of HeLa cells were loaded with two fluorescently tagged dextrans: the pH-sensitive Oregon green 488–dextran and the pH-insensitive tetramethylrhodamine-dextran. Individual lysosomal pH was measured by ratiometric fluorescence microscopy, and fluorescence values were converted to pH as described in the Conversion of fluorescence ratio to pH section in Materials and methods. The fraction of total lysosomes as a function of pH was plotted (n = 105 individual lysosomes from three independent experiments). (b) The lysosomes of HeLa cells were loaded with Alexa Fluor 647–dextran (magenta) and then loaded with the acidotropic dye LysoTracker (green) and imaged by confocal microscopy. The cell of interest is outlined with a dashed line. White boxes delineate two regions, labeled 1 and 2, which were used to superimpose the two channels in the right-hand insets. Here and elsewhere, white indicates overlap of the signals. (c) Cells expressing soluble EGFP were loaded with Alexa Fluor 647–dextran and LysoTracker. The outline of the cells was defined from the pattern of EGFP fluorescence (not depicted) using Volocity software and was degraded inward by 4.2 µm every cycle (three times) to create four concentric shells (dashed lines), which were used for the calculations shown in d. (d) The fraction of overlapping features (dextran-positive lysosomes containing LysoTracker) for each shell was determined and plotted as a function of distance from the edge of the cell. Error bars represent SEM (n = 10 cells from three independent experiments). Bars, 10 µm.

