Figure 8.
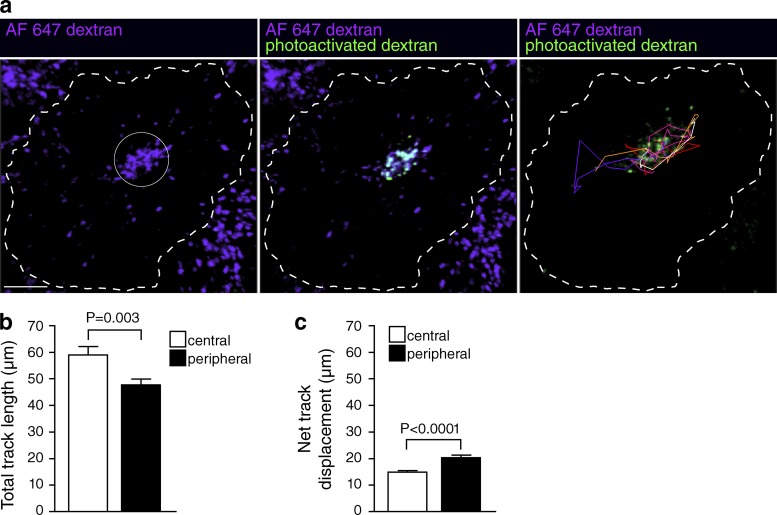
Assessment of lysosomal mobility by photoactivation. (a) Lysosomes were loaded with Alexa Fluor 647–dextran (purple) and CMNB-caged carboxyfluorescein-dextran. A ROI (indicated by solid white circle) was selectively illuminated using a 405-nm laser to photoactivate the CMNB-caged carboxyfluorescein-dextran (green in middle and right panels). The resulting fluorescence was imaged using a 488-nm laser every 1 min for 30 min or every 4 min for 2 h. Photoactivated lysosomes were tracked using Imaris software (right). (b) Lysosomes were tracked in cells where CMNB-caged carboxyfluorescein-dextran was photoactivated in either the cell center or the cell periphery. The total track length over 30 min was quantified. Error bars represent SEM (n = 104–204 lysosomes from three to five cells from five independent experiments). (c) The net displacement over 2 h was quantified. Error bars represent SEM (n = 137–285 lysosomes from three to seven cells from two independent experiments).

