Figure 9.
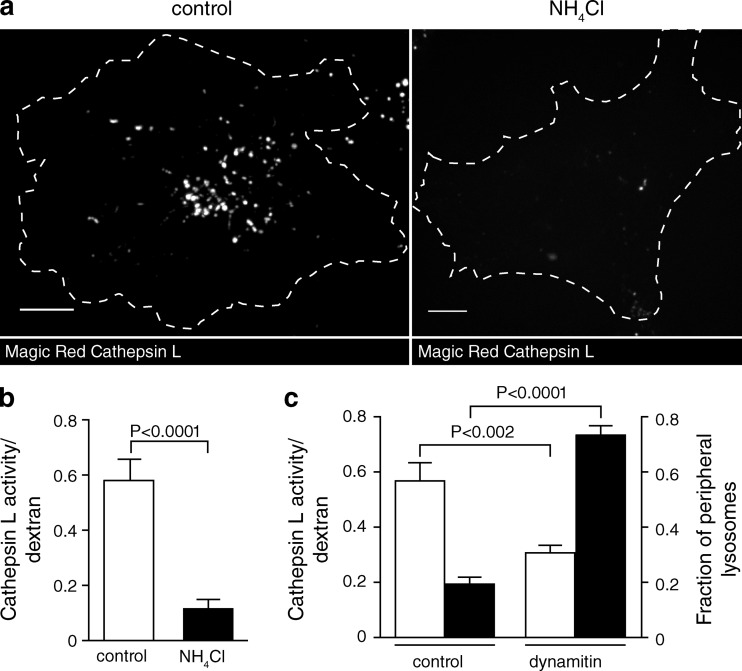
Peripheral lysosomes exhibit lower cathepsin L activity than central lysosomes. (a) Lysosomes were loaded with Alexa Fluor 647–dextran (not depicted) and incubated with Magic Red cathepsin L substrate (shown in gray/white). On the right, lysosomes were alkalinized with NH4Cl before Magic Red addition. Cells were imaged by confocal microscopy. Bars, 10 µm. (b) Cathepsin L activity was quantified in untreated and NH4Cl-treated cells by normalizing Magic Red fluorescence to Alexa Fluor 647–dextran fluorescence. n = 15–17 cells for each condition from three independent experiments. (c) Lysosomes were loaded with Alexa Fluor 647–dextran followed by transfection with EGFP or dynamitin-EGFP. Finally, the cells were incubated with Magic Red cathepsin L substrate and imaged by confocal microscopy. Cathepsin L activity (left y axis, unshaded bars) was quantified by normalizing Magic Red fluorescence to Alexa Fluor 647–dextran fluorescence. n = 20–26 cells for each condition from three independent experiments. The fraction of peripheral lysosomes (right y axis, shaded bars) was determined using Volocity software. The boundary of the cells was determined and was degraded inward by 9.1 µm to create two shells. The fraction of total lysosomes in the outermost shell for control cells and dynamitin-EGFP–expressing cells was determined and plotted. n = 13 from three independent experiments. Error bars represent SEM.

