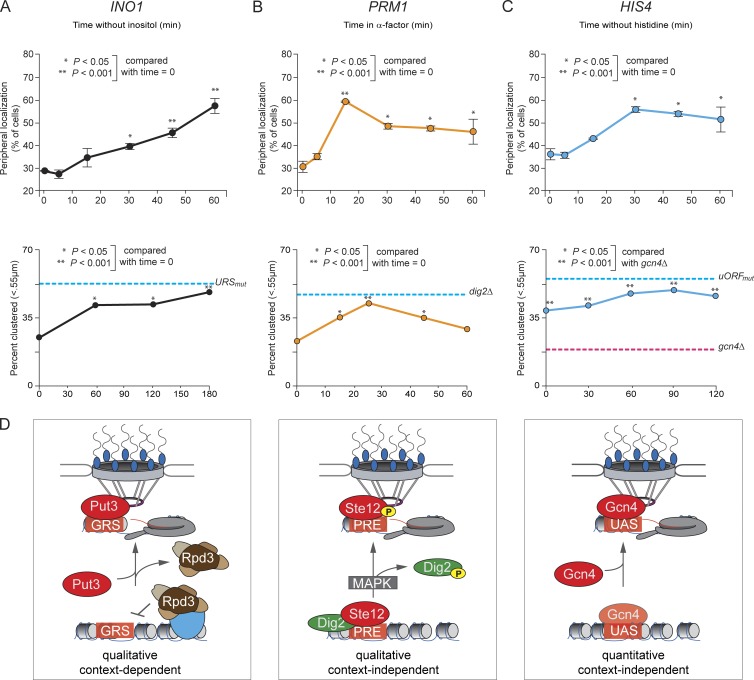
Figure 9.
Different regulatory strategies lead to large-scale changes in nuclear organization over different time scales. (A–C) Time course after shifting to –inositol (A), +α-factor (B), or –histidine (C). (top) Peripheral localization of INO1 (A), PRM1 (B), and HIS4 (C). (bottom) Percentage of cells in which the two loci were ≤0.55 µm for INO1 versus INO1 in diploid cells (A), PRM1 versus URA3:3×PRE in haploid MATa cells (B), and HIS4 versus HIS4 in diploid cells. (D) Schematic for three distinct mechanisms of regulation of gene positioning. *, P ≤ 0.05; **, P ≤ 0.001 (Fisher exact test) between SDC and inducing condition.

