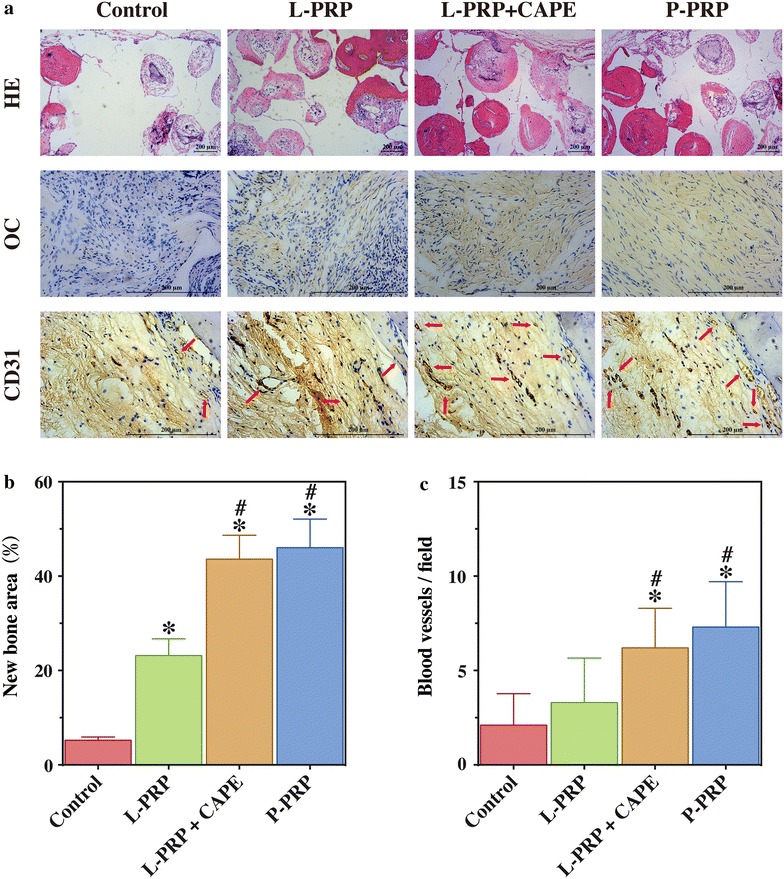
Fig. 10.

HE staining and immunohistochemical staining in the defects after 8 weeks postoperatively. a line 1, HE staining of new bone formation (red area) in the defects; line 2, the immunohistochemical staining of OC showed that there was almost no positive staining for OC in the control group, a limited amount in the L-PRP group, and a greater amount in the L-PRP + CAPE and P-PRP group; line 3, the immunohistochemical staining of CD31 showed that there were more new vessels, which were defined by positive CD31 staining and the typical round or oval structure (red arrows), in P-PRP and L-PRP + CAPE group than in the L-PRP and the control group (line 3); b quantitative analysis of the HE staining; c quantitative analysis of the CD31 staining. Bars represent the means and standard deviation (n = 10), and scales represent 200 μm; * indicates the statistically significant difference compared with the control group (P < 0.05); # indicates the statistically significant difference compared with the L-PRP group (P < 0.05)
