Fig. 4.
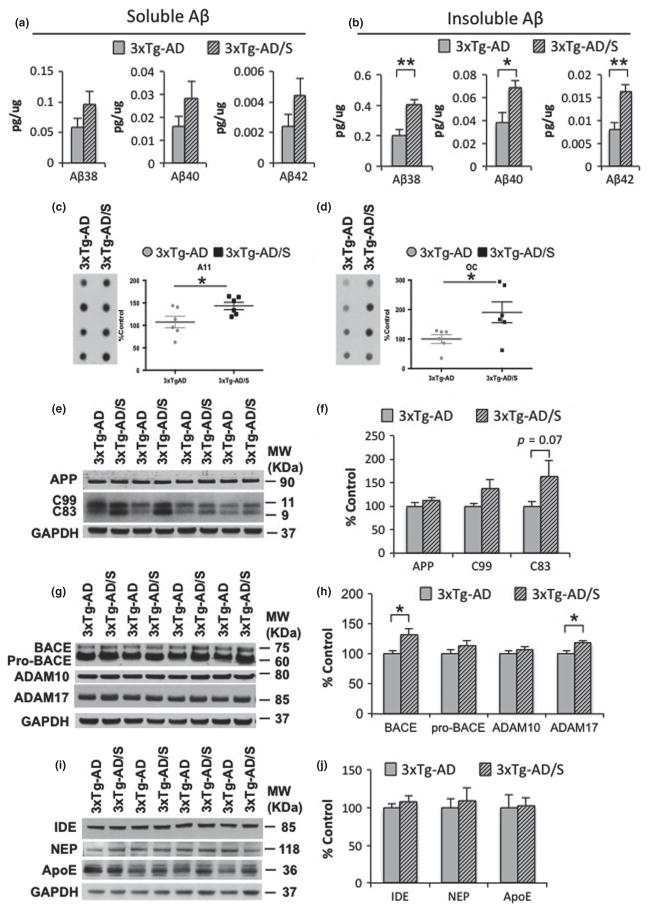
Multimodal acute stress increases Aβ levels. (a and b) Aβ measurements by sandwich ELISA of both the soluble and insoluble (Aβ1-38: 98.18 ± 15.80%, **p < 0.01, t-test; Aβ1-40: 78.40 ± 16.93%, *p < 0.05, t-test; Aβ1-42: 99.96 ± 20.20%, **p < 0.01, t-test) fractions shows an increase in Aβ levels in stressed 3xTg-Alzheimer’s disease (AD) mice compared to non-stressed mice. (c and d) Dot blot analysis shows a significant increase in the level of Aβ–oligomers recognized by the antibody A11 (c) (43.27 ± 8.12%, *p < 0.05, t-test) and OC (d) (90.60 ± 35.40%, *p < 0.05, t-test) in stressed 3xTg-AD mice compared to non-stressed mice. (e) Immunoblot analysis of AβPP holoprotein and C-terminal amyloid precursor protein (APP) fragment (CTFs) C99 and C83 from hippocampal-brain homogenates of non-stressed and stressed 3xTg-AD mice at 5–6 month-old shown as alternating lanes. (f) Quantification of E normalized to GAPDH and expressed, as a % of control shows no differences in AβPP and C99 in non-stressed versus stressed 3xTgAD mice. In addition, significant differences were observed in C83 levels (82.12 ± 37.91%, p = 0.07, t-test). g) Immunoblot analysis of constitutive proteases, including beta-site amyloid precursor protein-cleaving enzyme 1 (BACE-1), ADAM-10 and -17 from hippocampal-brain homogenates of non-stressed and stressed 3xTg-AD mice at 5–6 month-old shown as alternating lanes. (h) Quantification of G normalized to GAPDH and expressed, as a % of control shows significant increases on BACE1 (31.79 ± 9.10%, *p < 0.05, t-test) and ADAM17 (18.84 ± 8.06%, *p < 0.05, t-test) in stressed 3xTg-AD mice compared to non-stressed 3xTg-AD mice. (i–j) Immunoblot analysis of insulin-degrading enzyme (IDE), neprilysin (NEP) and anti-apolipoprotein E (ApoE) from hippocampal-brain homogenates of non-stressed and stressed 3 × Tg-AD mice at 5–6 month-old shown as alternating lanes. The values represent the mean ± SEM (N = 6). *p < 0.05 and **p < 0.01.

