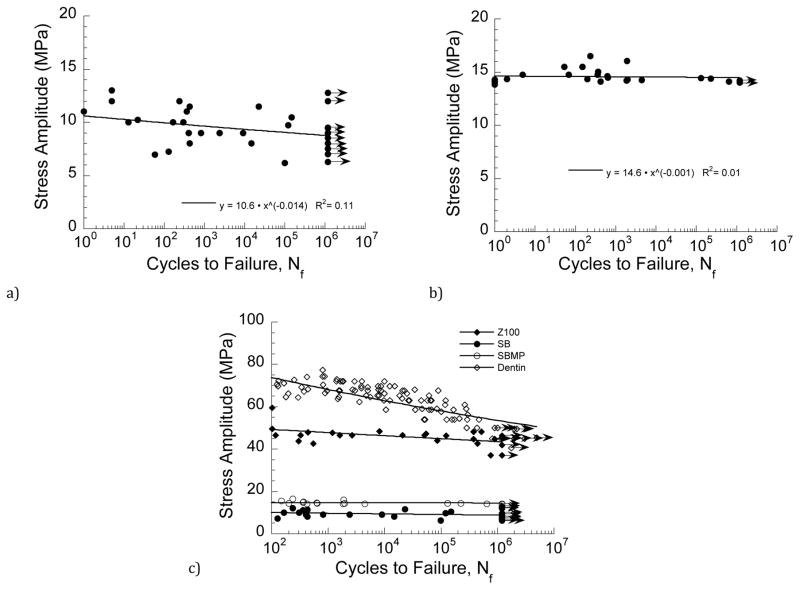
Figure 3.
Stress life diagrams for the bonded interface specimens. a) SB, b) SBMP, c) comparison of results from (a) and (b) with Z100 and dentin. Note that the data points with arrows represent those specimens that reached 1.2×10⁶ cycles and the test was discontinued. The R^2 values in (a) and (b) represent the coefficient of determination. Results for dentin in (c) are from [33].

