
Fig. 1.
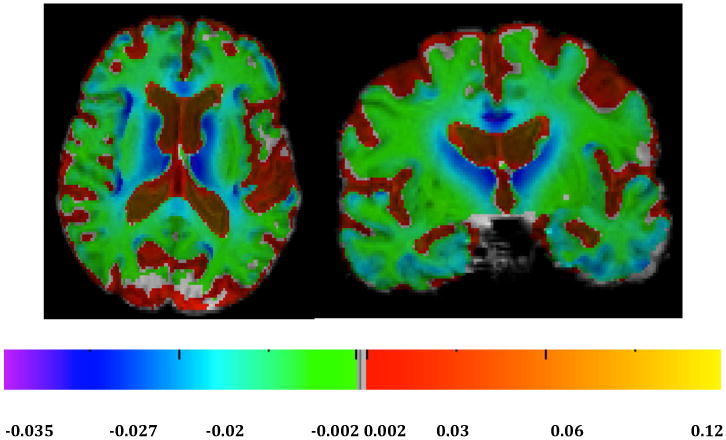
Average log-jacobians for normal cohort. Left: axial. Right: coronal. Color bars indicate magnitude changes (approximately % change) over normalized two-year period.
Official websites use .gov
A
.gov website belongs to an official
government organization in the United States.
Secure .gov websites use HTTPS
A lock (
) or https:// means you've safely
connected to the .gov website. Share sensitive
information only on official, secure websites.
Average log-jacobians for normal cohort. Left: axial. Right: coronal. Color bars indicate magnitude changes (approximately % change) over normalized two-year period.