Fig. 3.

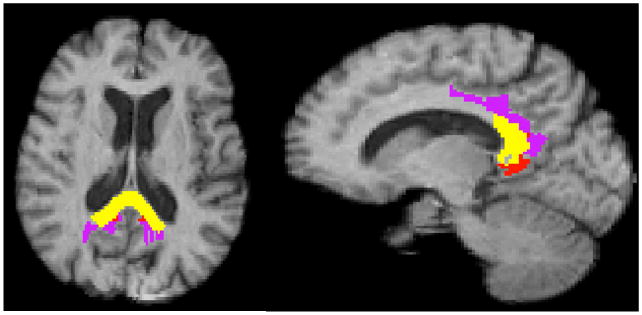
ROI overlaps with significant clusters of Fig. 1. Overlaps with clusters of significant interaction PiB × HA, t > 2.5. Yellow: splenium. Purple, posterior cingulum (Brodmann 23); Red: retrosplenial cortex (Brodmann 26-29).

ROI overlaps with significant clusters of Fig. 1. Overlaps with clusters of significant interaction PiB × HA, t > 2.5. Yellow: splenium. Purple, posterior cingulum (Brodmann 23); Red: retrosplenial cortex (Brodmann 26-29).