
Figure 3. Estimated 2004 Production Function for One-Year AMI Survival: Low Diffusion (Solid), High Diffusion for Factor A (Dotted) and High Diffusion for Factor B (Dashed).
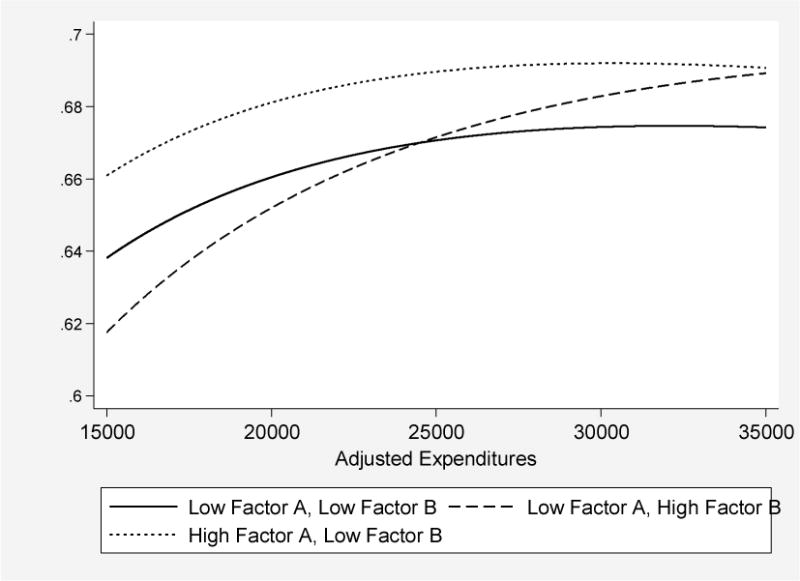
Note: The figure plots predicted one-year survival, based on regression analysis reported in Appendix Table A.2 with hospital fixed effects, for three hypothetical hospitals: A hospital that is one standard deviation below average on both adoption factors (Low Factor A, Low Factor B), a hospital that is one standard deviation below average on Factor B but one standard deviation above average on Factor A (High Factor A, Low Factor B), and a hospital that is one standard deviation below average on Factor A but one standard deviation above average on Factor B (Low Factor A, High Factor B). While the slope and shape of the production function comes directly off the estimated coefficients, the intercepts for each of these three curves are derived from a between-hospital regression of the hospital fixed effects regressed on the two factors, their squares, and their interactions.