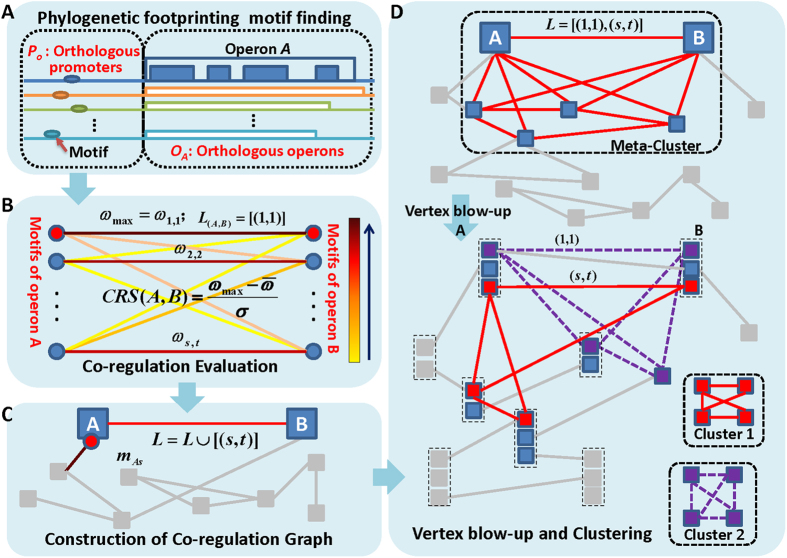
Figure 1. An outline of the regulon prediction framework.
The blue arrows indicate data flows within this framework; and the blue rectangles represent different steps across the whole analysis. (A) Identification of motifs by a phylogenetic footprinting framework; (B) calculation of co-regulation score between a pair of operons by a highly sensitive motif similarity score. The higher the similarity score is, the darker of the corresponding edge’s color will be; (C) construction of graph G reflecting the co-regulation relationship among operons based on the similarity of their predicted motifs; and (D) vertex blow-up in graph G by re-involving motif information and clustering operons to construct accurate regulons.

