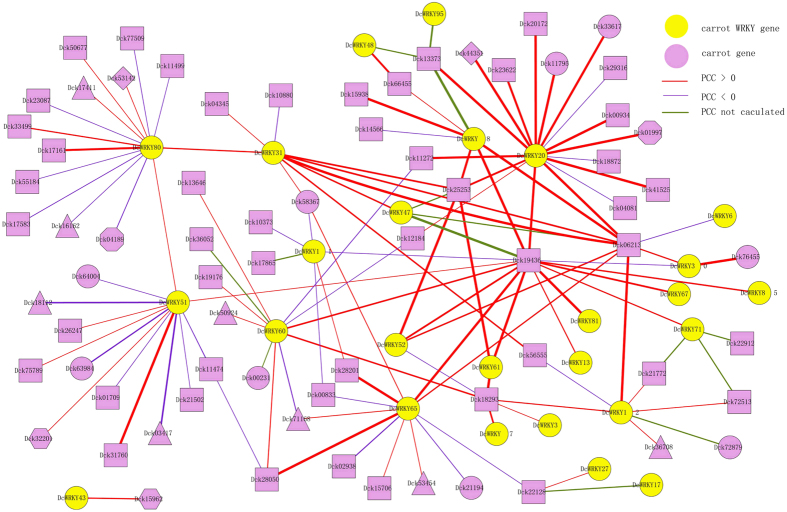
Figure 6. Interaction network of WRKY factors in carrot according to the orthologs in Arabidopsis.
PCC: Pearson correlation coefficient. Different graphical represent the subcelluar location of different proteins. Ellipse: Nucleus; Rectangle: Unclear; Triangle: Plastid; Diamond: Vacuole; Hexagon: Unclear.

