
Figure 3. The lattice constant c as a function of temperature for 13-nm and 60-nm VO2 films.
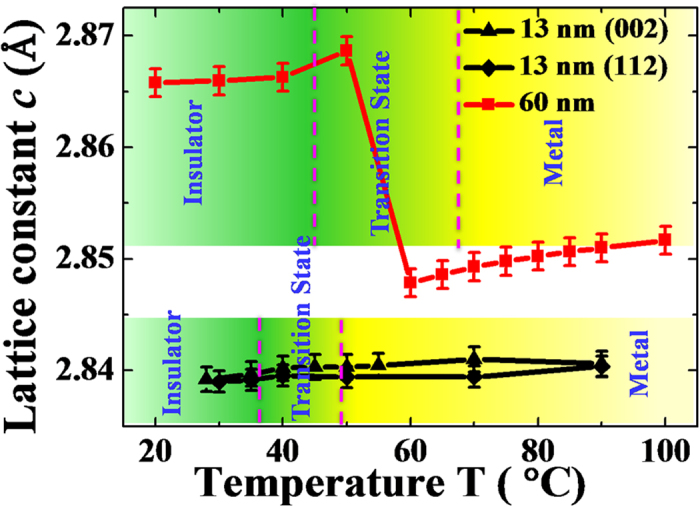
The red square line represents the c of 60-nm VO2 thin film. The triangle and diamond lines represent the c of the 13-nm VO2 thin film calculated from (002) and (112) diffraction spots in the RSMs, respectively. The mixed regions of yellow and green shadows highlight the transition temperature ranges of the 13-nm and 60-nm films that were divided by dashed lines.