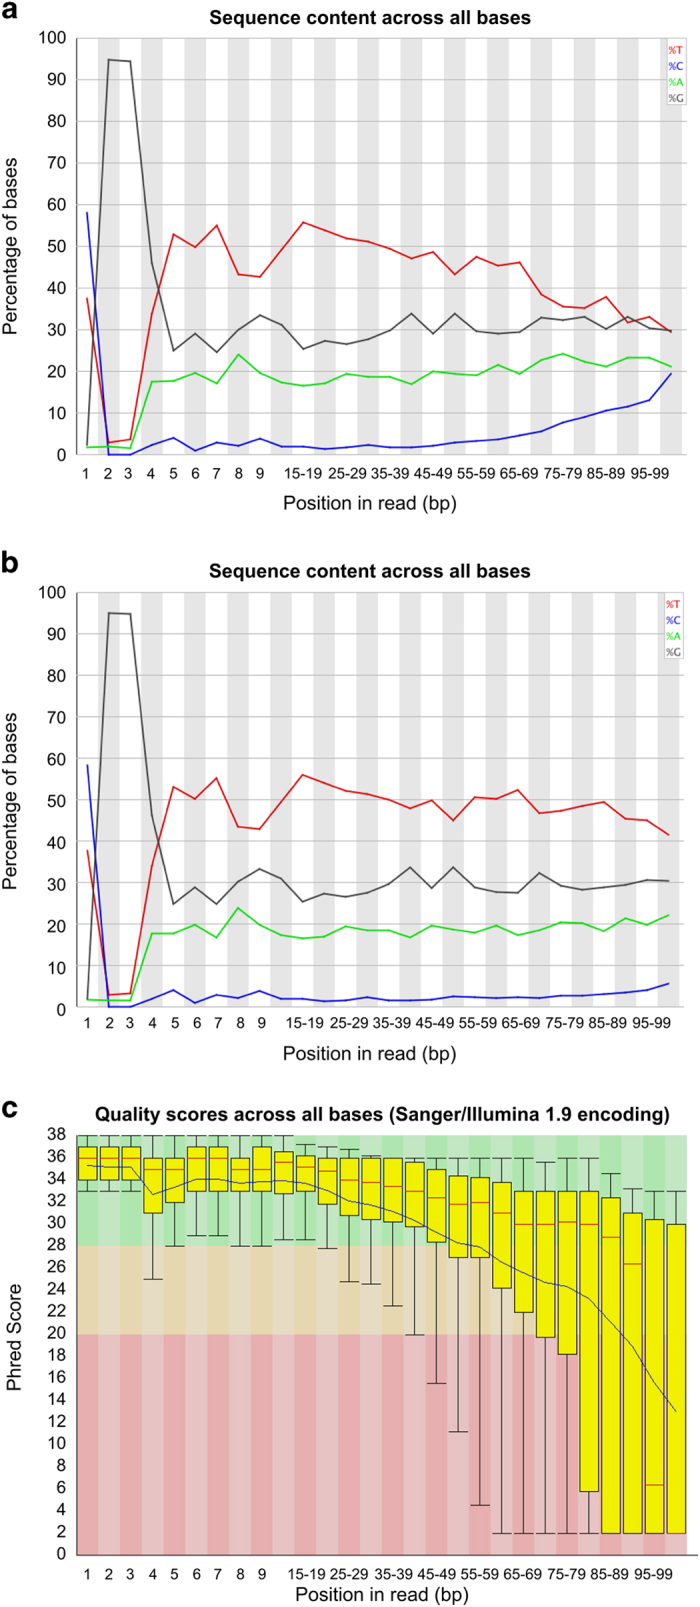
Figure 2. A representative example of signatures and quality of RRBS sequenced reads (sample: X9015).

(a) Per base sequence content as indicated by FastQC of the raw sequenced reads. The X-axis plots the sequencing cycle or positions in reads. The Y-axis represents percentages if the occurrence of the bases along the read. (b) Per base sequence content as indicated by FastQC after adaptor sequence removal. (c) A representative example of per base sequence quality for RRBS data (sample: X9015). For each position a Box and Whisker plot of the Phred quality scores is drawn. The central red line is the median value. The yellow box represents the inter-quartile range (25–75%). The upper and lower whiskers represent the 10 and 90% points. The blue line represents the mean quality.
