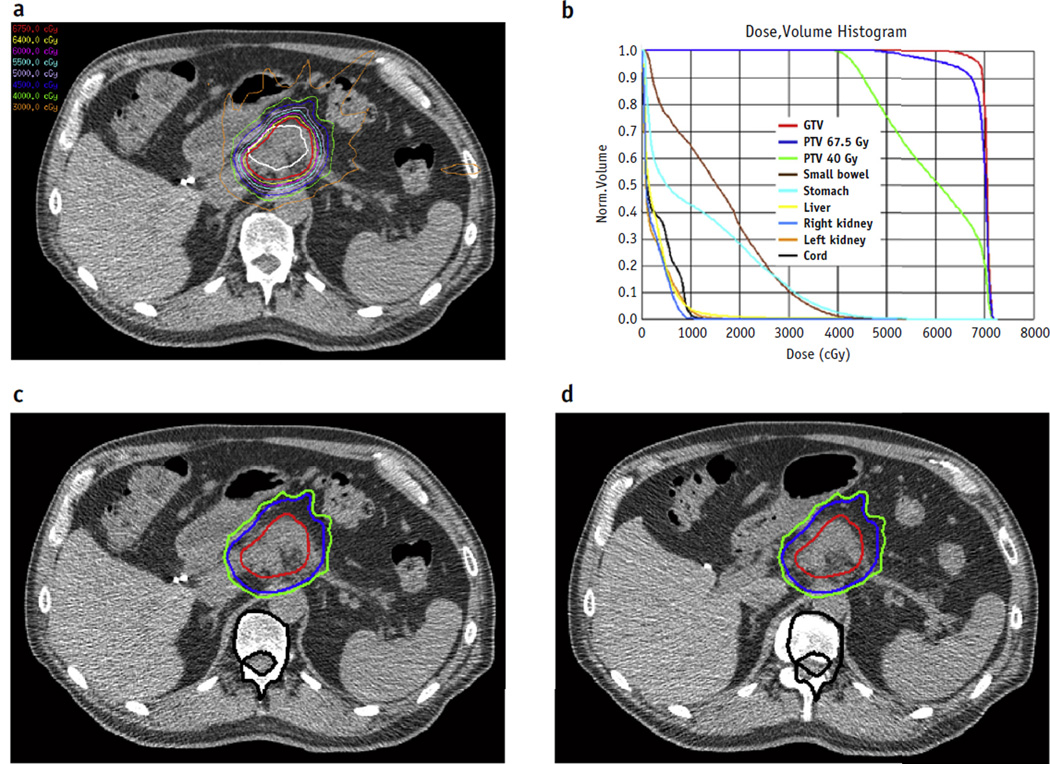
Fig. 1.
A representative plan of a patient treated with radiation dose escalation (biologically effective dose >70 Gy). (a) Axial isodose plots and (b) dose-volume histogram corresponding to a planned course of treatment. The patient was aligned daily by mapping soft-tissue anatomy and isodose lines between (c) a reference computed tomography scan obtained at simulation and (d) a computed tomography scan obtained on the day of treatment. Black contours are vertebral bodies; red isodose lines indicate 67.5 Gy, blue 45 Gy, and green 40 Gy. As noted here, alignment to bony landmarks would have resulted in an increased dose to the stomach wall. Abbreviations: GTV Z gross tumor volume; PTV Z planning target volume. A color version of this figure is available at www.redjournal.org.

