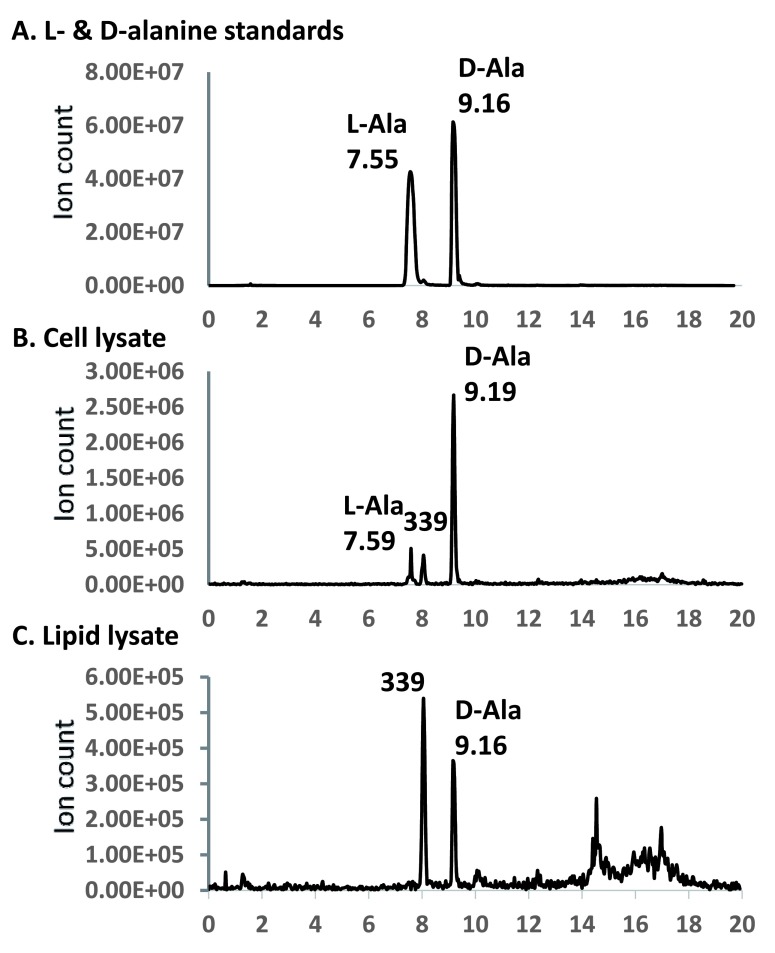
Figure 8. LC/MS chromatograms of alanine in cell and lipid lysates.
The 340 amu molecular anion was monitored. The horizontal axis corresponds to retention time (minute). Peak retention times are marked. The peaks at 8.05 minutes, which correspond to a background 339 amu anion, is marked with “339”.

