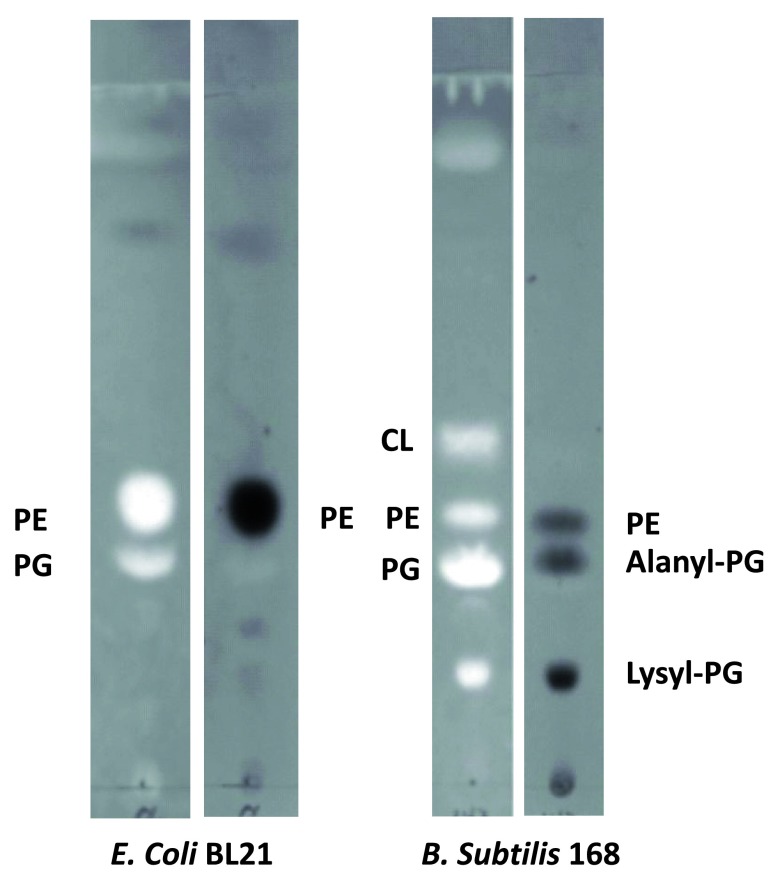
Figure 1. Thin-layer chromatogram of total lipids extracted from E. coli strain BL21(DE3) and B. subtilis strain 168.
Major components of the bands are shown. Bright panels: Primuline-stained TLC sheet. Dark panels: Ninhydrin-stained TLC sheet. The fluorescent primuline (bright spots) is absorbed to hydrophobic molecules. Ninhydrin reacts with amino groups to produce purple products (dark spots). Lysyl-phospholipids form a distinct band with slow mobility. Alanyl-PG migrates slightly faster than PG, but significantly slower than PE. The Gram-negative E. coli has little CL.

