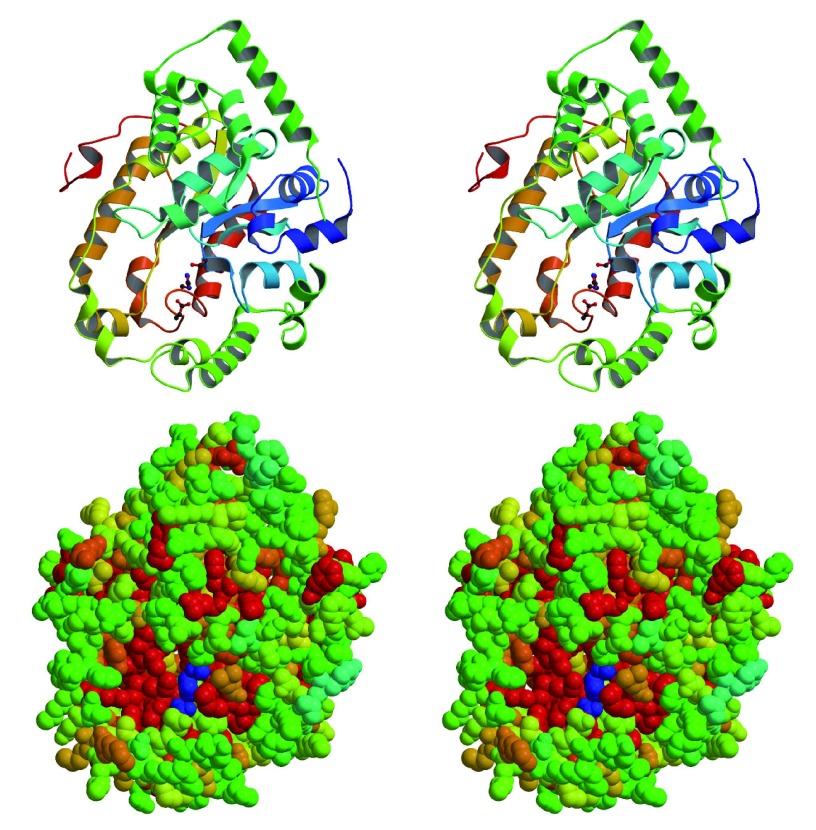
Figure 11. Structure of DltD from Streptococcus pneumoniae in stereo.
A, Ribbons diagram of DltD. The side chains in the Ser-His-Asp triad are shown in ball-and-stick model. B, Space-filling model of DltD. The most conserved residues are shown in red, and the least conserved in green. The putative catalytic triad is shown in blue.

