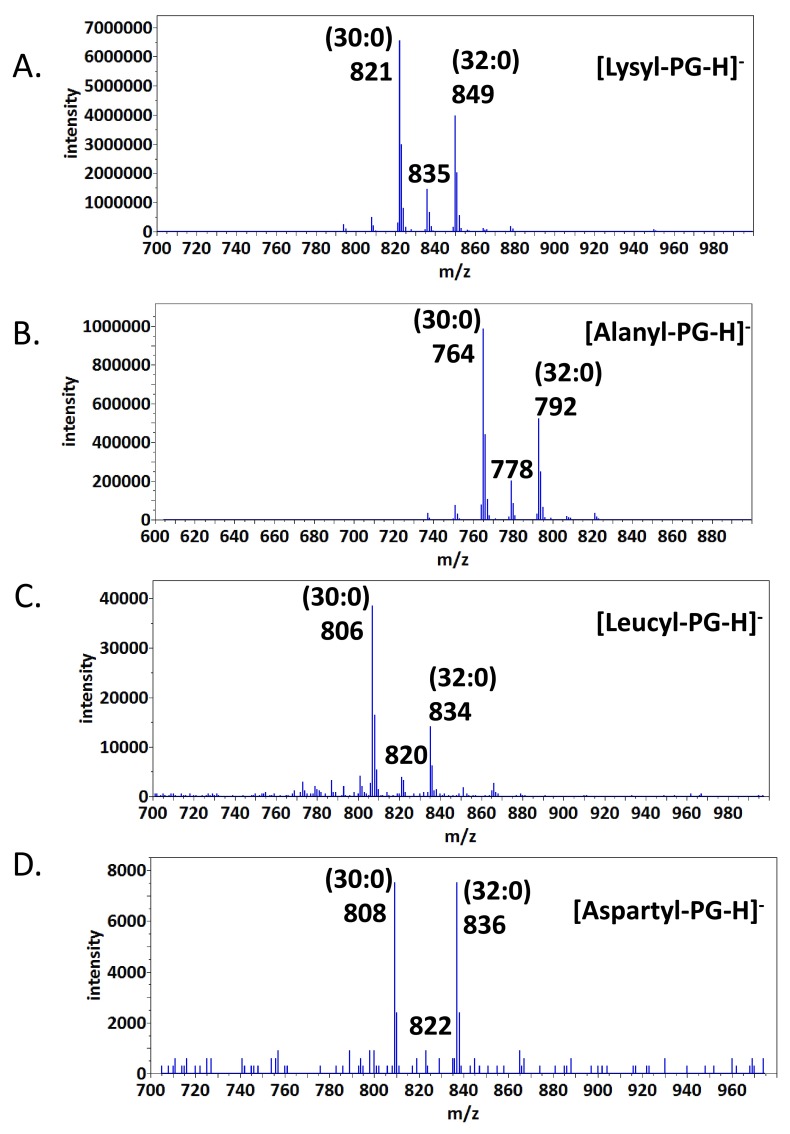
Figure 3. Precursor scans for aminoacyl-PGs.
Major peaks in the spectra are labeled with fatty acid composition (number of carbon atoms: number of desaturation). A. Scan for precursors of a 145 amu anion. B. Scan for precursors of a 88 amu anion. C. Scan for precursors of a 130 amu anion. D. Scan for precursors of a 132 amu anion.

