Figure 1.

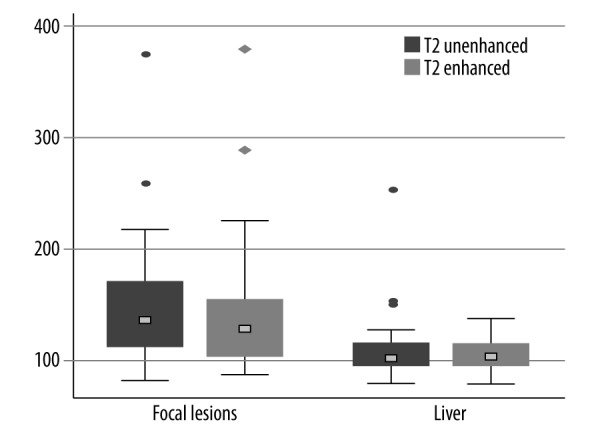
Box plots of T2 relaxation times of the liver and focal liver lesions before and after the administration of Gd-EOB-DTPA. No significant differences between the mean pre-contrast and post-contrast values were noted (P>0.05).

Box plots of T2 relaxation times of the liver and focal liver lesions before and after the administration of Gd-EOB-DTPA. No significant differences between the mean pre-contrast and post-contrast values were noted (P>0.05).