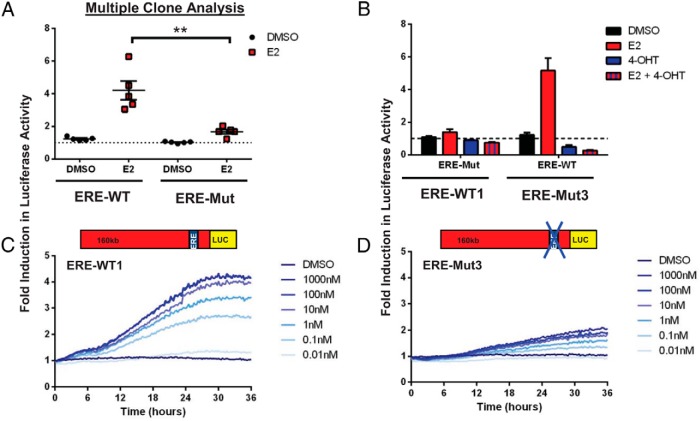
Figure 2.
Estrogen responsiveness of ERE-WT and ERE-Mut BAC cell lines. E2 stimulation (10nM) of 5 individual serum-starved (24 h) ERE-WT and ERE-Mut clones; after treatment for 24 hours with either 10nM E2 or vehicle control (0.1% dimethylsulfoxide [DMSO]), cells were lysed and assayed for Luc activity; **, P < .001 (A). Effect of E2 cotreatment with the E2 antagonist 4-OHT (1000nM) in ERE-WT1 and ERE-Mut3 cell lines (B). Live cell luminometry of serum-starved (24 h) ERE-WT1 (C) and ERE-Mut3 (D) cell lines using increasing concentrations of E2 with Luc activity measured every 15 minutes. The dotted line indicates the baseline determined from untreated control samples. Results are shown as fold induction ± SD from the untreated control sample with values representing the mean of at least 3 independent experiments, each with 3 replicates.

