Figure 3.
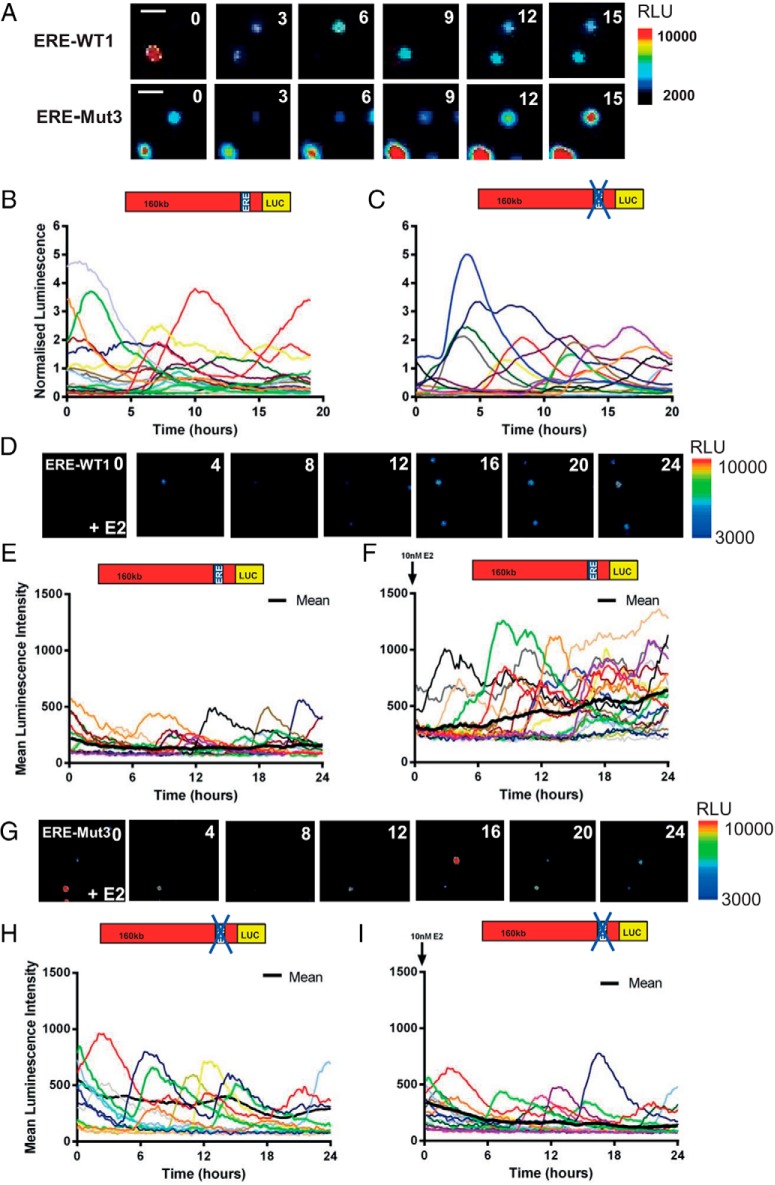
Single cell transcriptional activity in ERE-WT and ERE-Mut BAC cell lines. Luminescence signal from ERE-WT1 and ERE-Mut3 BAC cell lines in serum containing media. Representative images of ERE-WT1 and ERE-Mut3 BAC cells, white line represents scale bar equal to 50μM (A). Single cell transcriptional traces from unstimulated ERE-WT1 (B) and ERE-Mut3 BAC cells (C) in serum containing media. Luminescence signal from serum-starved ERE-WT1 cells: representative images after 10nM E2 treatment (D) and single cell transcriptional traces from untreated (E) and 10nM E2-treated cells (F). Luminescence signal from serum-starved ERE-Mut3 cells. Representative images after 10nM E2 treatment (G) and single cell transcriptional traces from untreated (H) and 10nM E2-treated cells (I). Colored lines represent data from single cells with the thick black line representing the mean population response; n = 21 cells (E), n = 19 cells (F), n = 22 cells (H), and n = 18 cells (I).

