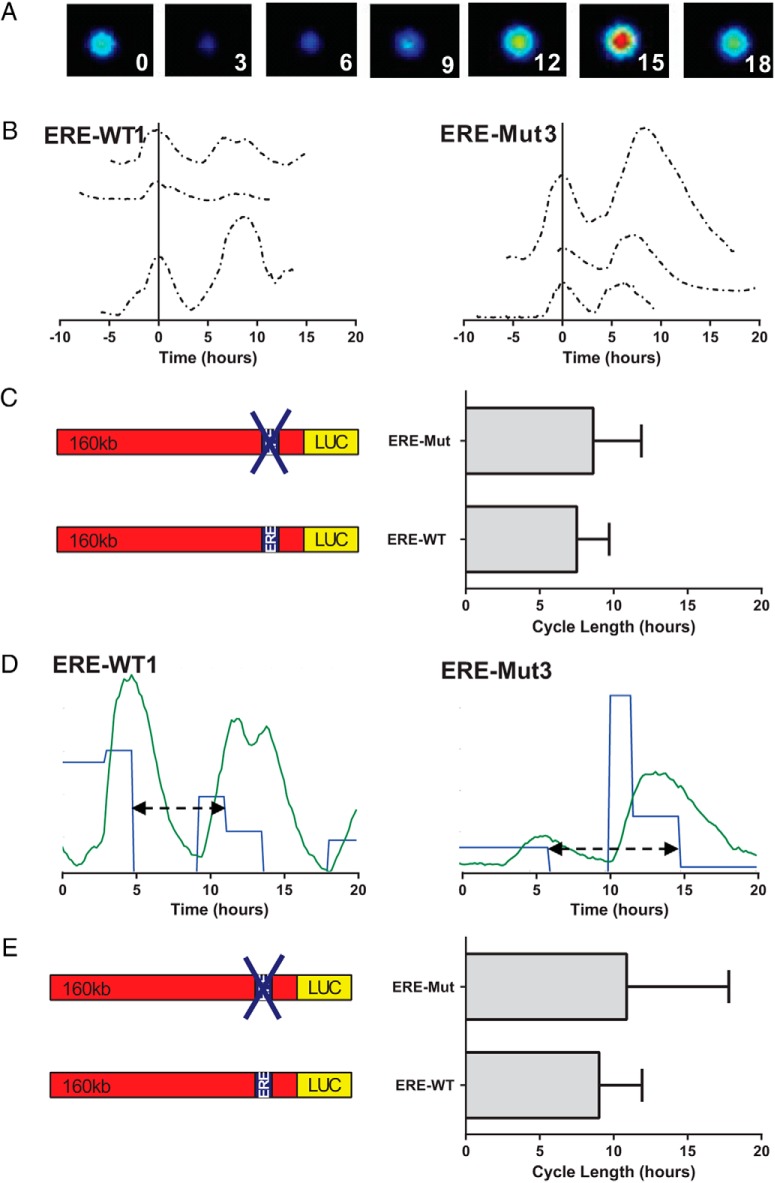
Figure 4.
PRL promoter transcription cycle length comparison of ERE-WT1 and ERE-Mut3 BAC cell lines. Representative images from ERE-Mut3 cell over time (A). Promoter activity from ERE-WT1 and ERE-Mut3 cell lines. Each line represents the transcriptional activity from a single cell with the first peak of each cell aligned to 0 (B). Mean cycle lengths are compared between ERE-WT1 and ERE-Mut3 cell lines. Bars show SD from 13 and 15 cells, respectively, from 3 experiments per cell type (C). SSM example traces from ERE-WT1 and ERE-Mut3 cell lines showing estimated temporal switches between variable transcription rates (blue) when back calculated from observed luminescence (green). A cycle (black arrow) was determined as the duration from the first decrease in rate to the next decrease in rate having followed an intermittent increase. D, Estimated cycle length determined from SSM, compared between ERE-WT1 and ERE-Mut3 cell lines. Bars show SD of this cycle length from 10 and 21 cells, respectively, in 3 experiments per cell type (E).

