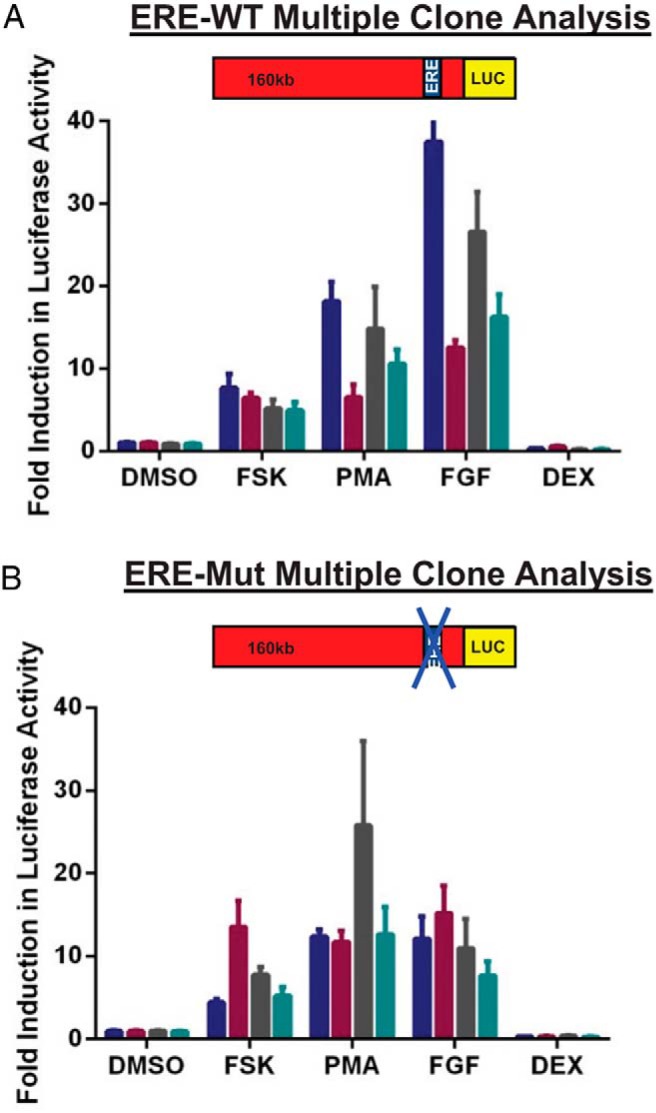
Figure 6.

Responses of ERE-Mut and ERE-WT cell lines to well-characterized hPRL regulating stimuli. Stimulation of 4 individual serum-starved ERE-WT (A) and ERE-Mut (B) cell lines (Fsk, 5μM; FGF-2, 10 ng/mL; PMA, 10nM; Dex, 10nM). Luc activity was measured 24 hours after drug treatment. Results are shown as fold induction ± SD from an untreated control sample. Values represent the mean of at least 3 independent experiments, each with 3 replicates. Each bar represents an individual clone.
