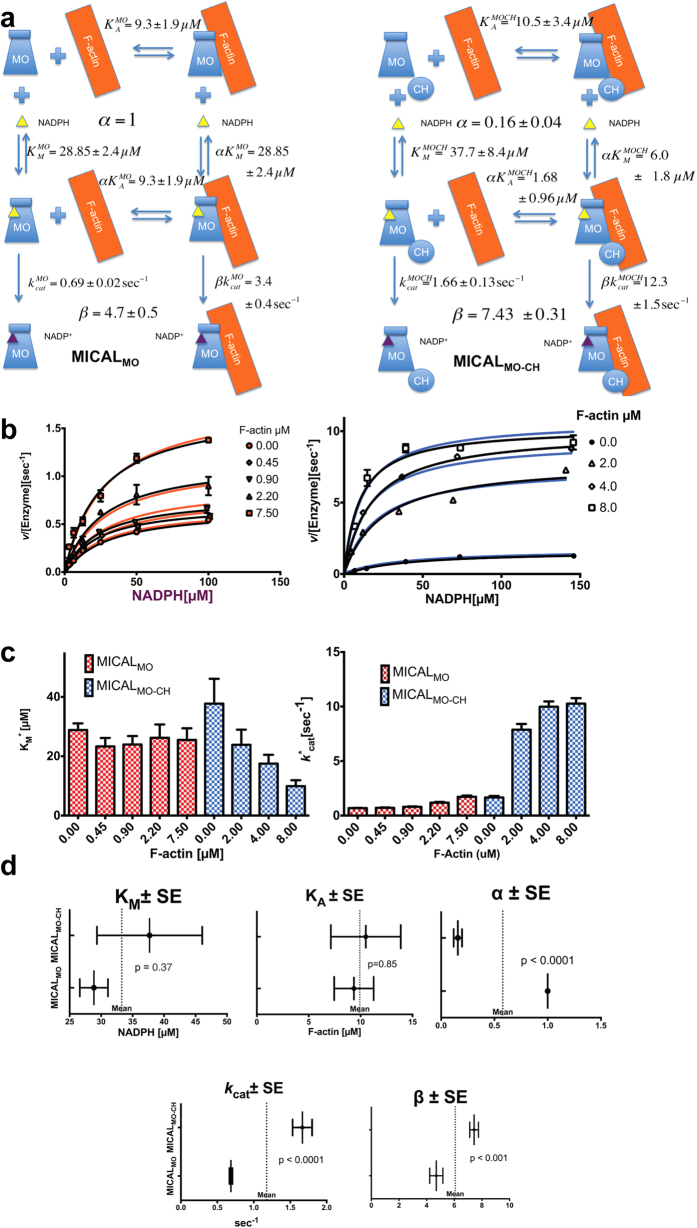
Figure 8. Steady state enzyme kinetics analysis.
(a) Rapid equilibrium diagrams for the system enzyme
(MICALX)/substrate (NADPH)/activator (F-actin). (Left) for
MICALMO and (right) for MICALMO-CH. The
equilibrium constants and rates in each branch are shown with their SE
calculated from the non-linear fit of Equation.
[1] to the initial rate of NADPH oxidation by
MICALMO and MICALMO-CH in presence of F-actin.
(b) Steady state velocities and their fitting with Equation (1) (color traces) and Equation (2) (black traces). The symbol error-bars represent the standard
error of the mean SEMs. (c) Apparent  and
and  of both constructs obtained by the
fitting the initial velocities for each value of [F-actin] with equation
(2). (d) Parameters of the global fitting
of MICALMO and MICALMO-CH using the non-essential
activator (F-actin) Equation (1), the parameter
α was constrained to 1 in the MICALMO dataset. Error bars
represent standard errors (SEs). All fitting and statistical tests were
performed using the program Prism 6 (GraphPad Inc.).

