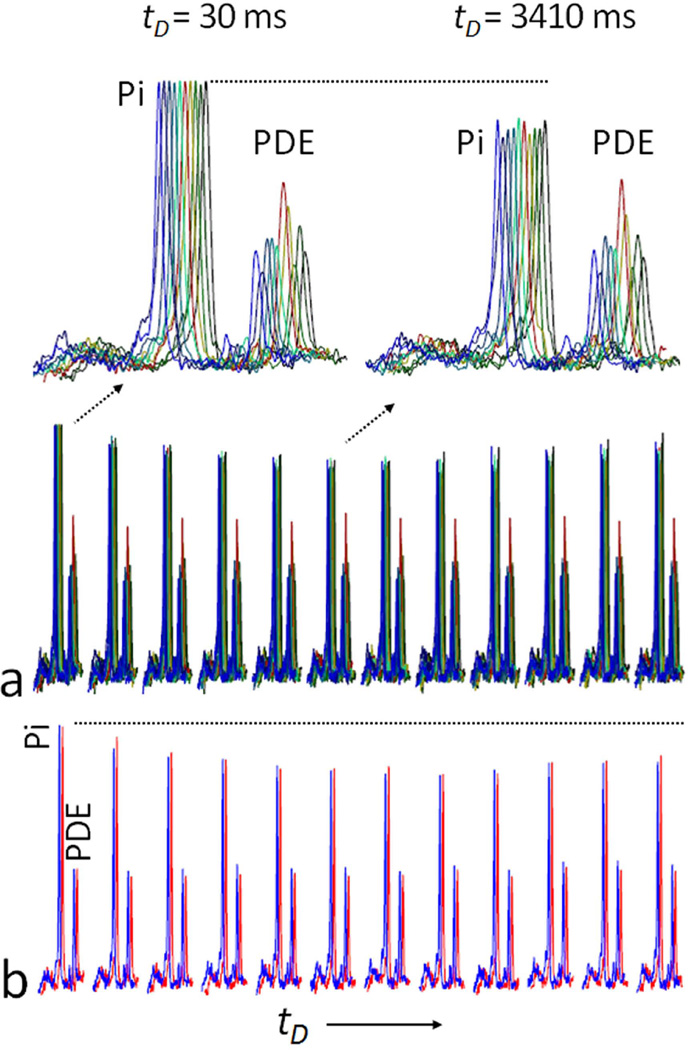
FIG. 5.
Variability in the intensity of Pi between subjects. Panel (a) shows the variation of EBIT data among all 10 subjects. After scaling to the baseline Pi signal, there was some variability in PDE among subjects. At a tD of ~ 3.4 seconds, the Pi signal was substantially reduced in all subjects with no detectable effect on PDE. Panel (b) shows one example of intra-session reproducibility of EBIT data acquisition during a repeated scans (red and blue traces) for the same subject. Inversion delay time tD = 30, 626, 1253, 1923, 2641, 3414, 4252, 5167, 6174, 7294, 8556 and 10000 msec. Abbreviation: Pi, Inorganic phosphate; PCr, phosphocreatine; ATP, adenosine triphosphate; PDE, phosphodiester.

