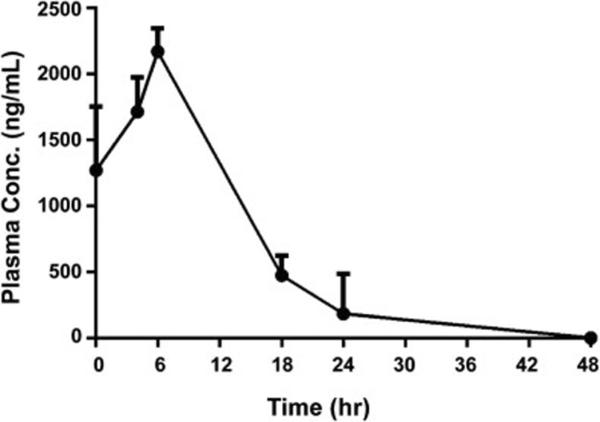
Fig. 4.

Pharmacokinetic analysis of entrectinib treated tumors. Representative graph indicating peak plasma concentrations (ng/mL) at about 6 hr post administration of the drug. After the final dose (60 mg/kg BID) was given, the blood samples were drawn from 4 mice per time point via retro-orbital bleeding, collected in heparinized tubes on wet ice, and plasma concentrations were measured as described in methods.
