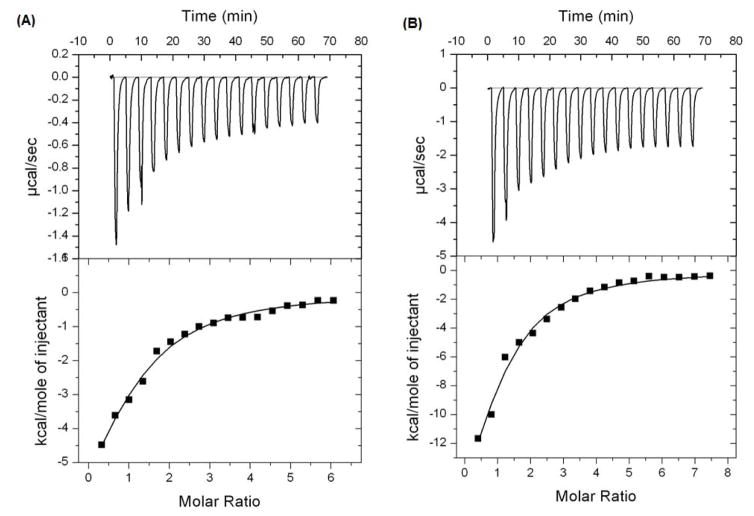
Figure 3.
Results of isothermal titration calorimetry (ITC) for GCGs binding to α-glucosidase: (Top) Raw data plot of heat flow against time for the titration of MF (A) or MJ (B) into 0.031 mM α-glucosidase enzyme protein. (Bottom) Plot of molar enthalpy change against GCGs/α-glucosidase enzyme molar ratio.

