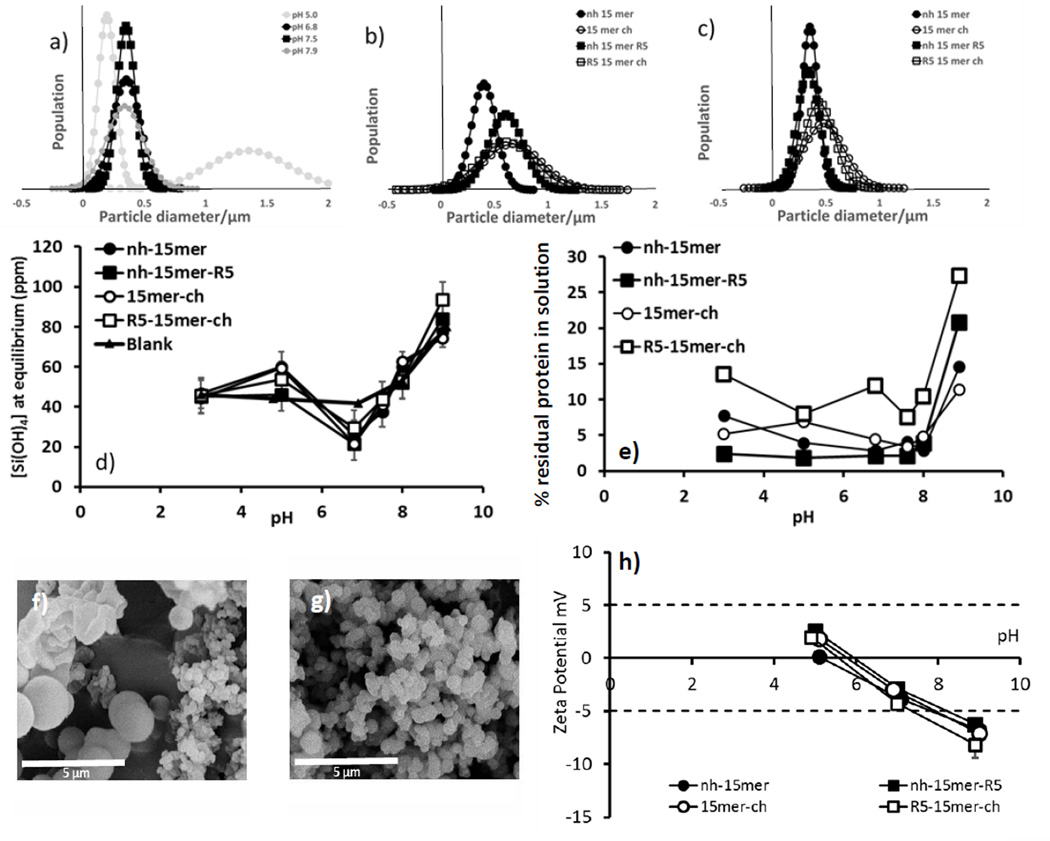
Figure 2.
Particle size analysis in solution of (a) nh-15mer condensed silica pH 5.0 – 7.9 (grey scale intensity indicates level of control shown at each pH (darker scale - more control)), (b) silica condensed at pH 6.8 and (c) at pH 7.5 in the presence of the different chimeras; solution concentration of (d) residual monosilicic acid and (e) silk chimeras at equilibrium time. Error analysis based on standard deviation on 5 separate samples (f), (g) example SEM images of nh-15mer at pH 5 (f) and 6.8 (g) (h) Zeta potential data over a range circumneutral pH’s for aqueous solutions, 1 mg/mL of the nh-15mer, nh-15mer-R5, 15mer-ch and R5-15mer-ch, N=5 for all methods other than particle size measurement by SEM where a minimum of 50 particles were measured.

