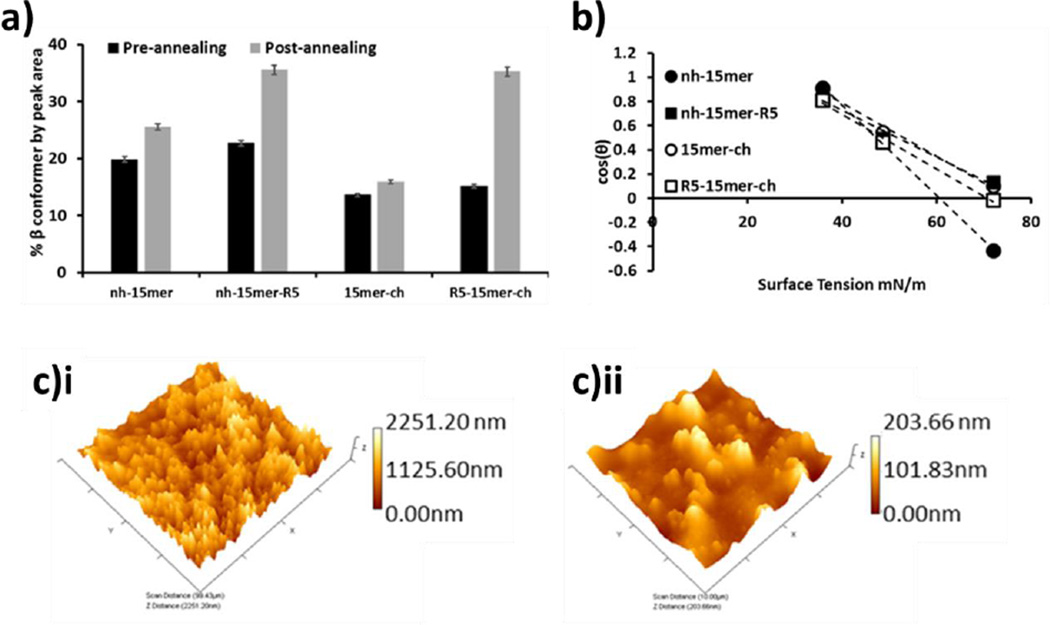
Figure 4.
(a) Nature of the nh-15mer, nh-15mer-R5, 15mer-ch and R5-15mer-ch silk films before and after annealing measured as percentage area assigned as β sheet or turn. Error statistics are the standard deviation of 3 peak fitting results for each sample. (b) Zisman plot of the genetic constructs. N=20. (c) Representative AFM 3D images for 15mer-ch sample i) before annealing ii) after annealing, scanned areas 100 µm.

