
Fig. 3.
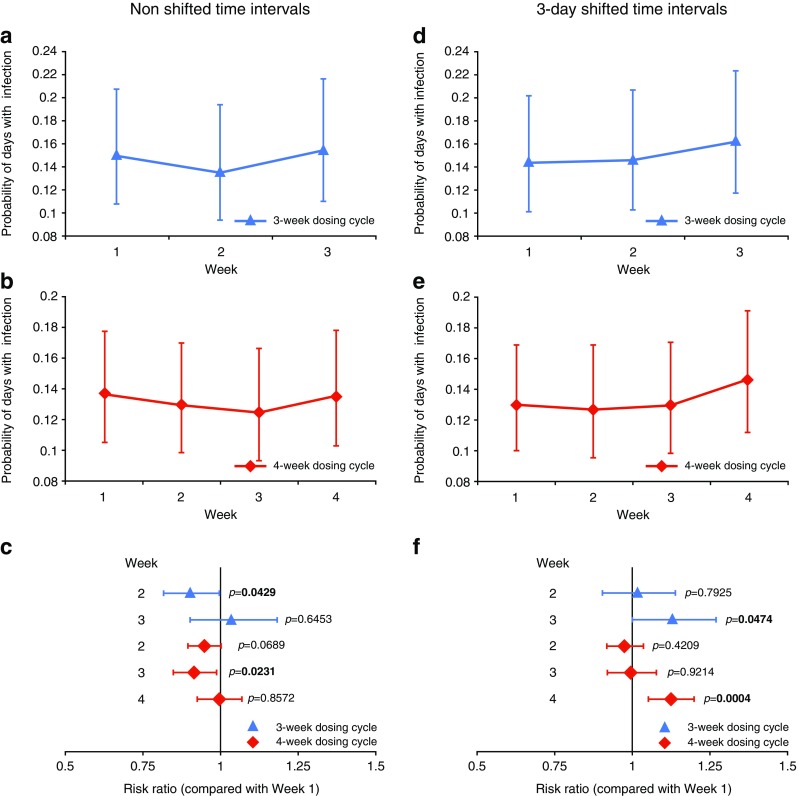
Probability of days with infection per week within the dosing cycle. The probability of days with infection, as determined by negative binomial distribution, is shown for each week of the 3-week (a and d) and 4-week (b and e) dosing cycles using non shifted (a and b) or shifted (d and e) time intervals; risk ratio of a day with infection during Week 1 of the dosing cycle compared with subsequent weeks using non shifted (c) and shifted (f) time intervals. Time intervals were shifted by 3 days to account for infection incubation period: Week 1 covers Days 3–9; Week 2 covers Days 10–16; Week 3 covers Days 17–23; and Week 4 covers Days 24–31. Error bars indicate 95 % CI