
Fig. 4.
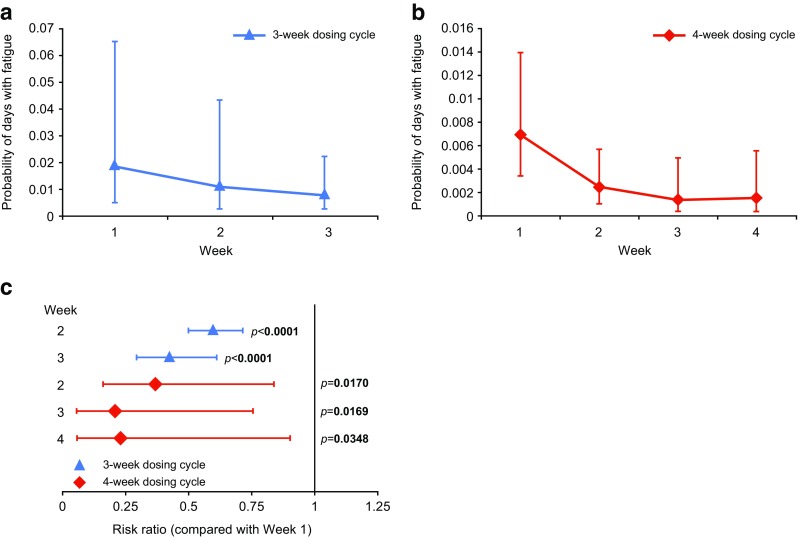
Probability of fatigue. Probability of days with fatigue, as determined by Poisson distribution at each week of a 3-week (a), or 4-week (b) dosing cycle is shown; risk ratio of fatigue during Week 1 of the dosing cycle compared with subsequent weeks (c). Error bars indicate 95 % CI