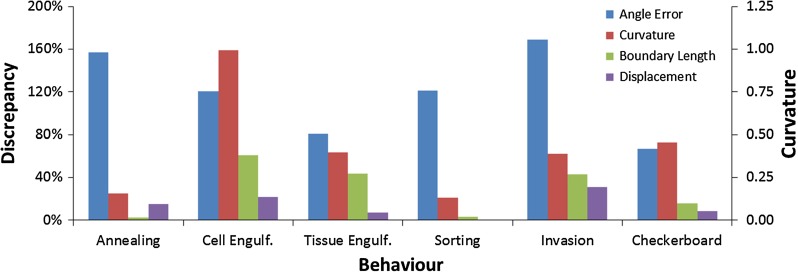
Fig. 3.

A comparison of monoline and polyline models. The models are compared in terms of angle error, curvature, boundary length and displacement for each cell interaction scenario. Details of the calculations are given in the text and may vary from one scenario to the next, depending on the particular features of interest. All values are reported as percentage differences between the monoline and polyline models (left ordinate), except for curvature (right ordinate)
