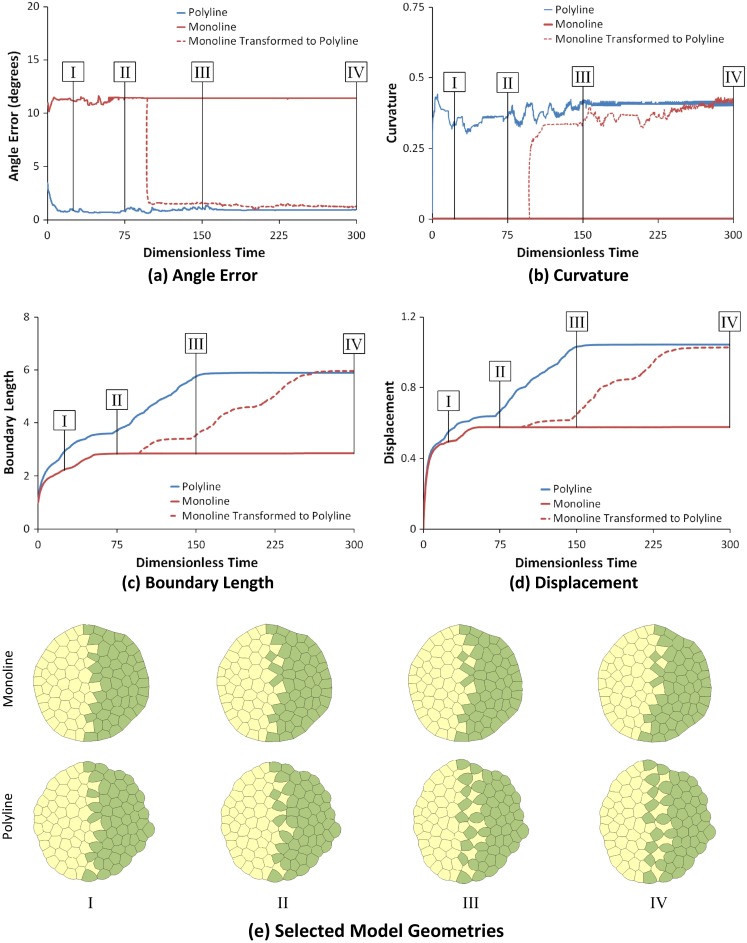
Fig. 5.

A closer look at invasion. As in Fig. 4, a shows median RMS angle error, b gives edge curvature, c reports the normalized total length of the yellow–green boundary and d shows the normalized horizontal displacement. e The geometries corresponding to the Roman numerals on the graphs
