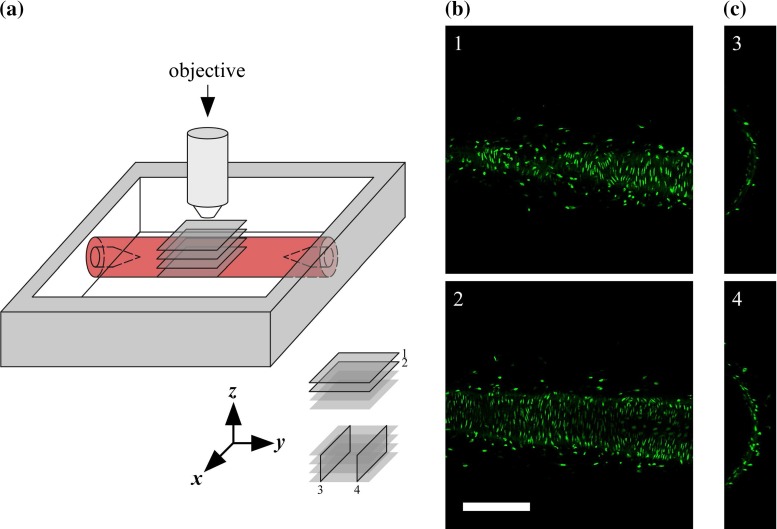
Fig. 1.
Data acquisition. a Measurement set-up. The common carotid artery is mounted between glass micropipettes and imaged with an upright microscope. 1 and 2 indicate example x–y image slices in b, and 3 and 4 indicate examples of reconstructed x–z image slices in c. b Example x–y image slices acquired at increasing imaging depth, i.e. at decreasing z-coordinate (1: , 2: ). Scale bar . c Examples of reconstructed x–z image slices. Figure scale equal to scale in b

