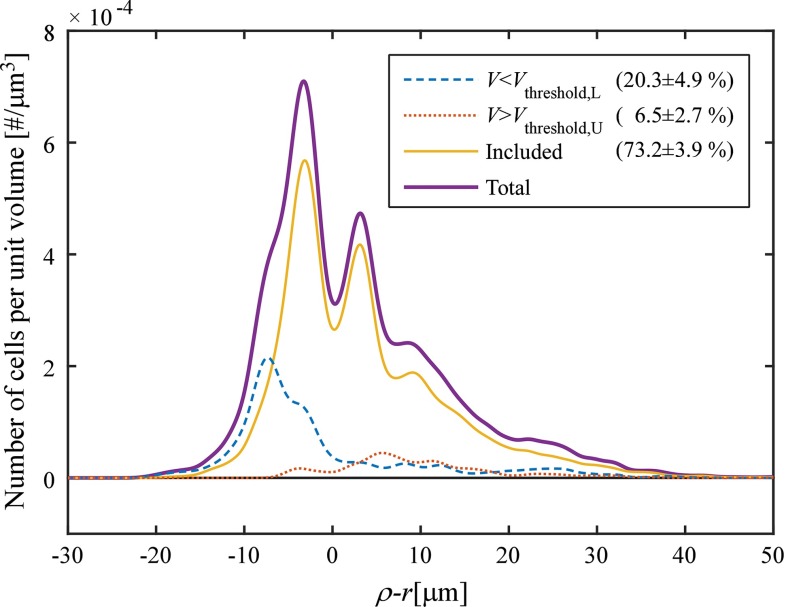
Fig. 11.
Effect of cluster volume thresholding. Curves show SMC density as a function of the relative radial coordinate (), where is the radial coordinate as defined in Fig. 3a and r is half of the detected vessel diameter (). Pooled data of five samples at a luminal pressure of are shown [those (non-rotated) samples that were also used for assessing reproducibility (Table 1) and the effects of rotation (Fig. 9)]. The lower volume threshold (, blue, dashed line) removed clusters mainly at the inner side of the wall, whereas the upper volume threshold (, red, dotted line) removed clusters mainly at the outer side of the wall. Percentages pertain to the number of clusters in each stack that were excluded/included, respectively (). SD standard deviation, SMC smooth muscle cell

