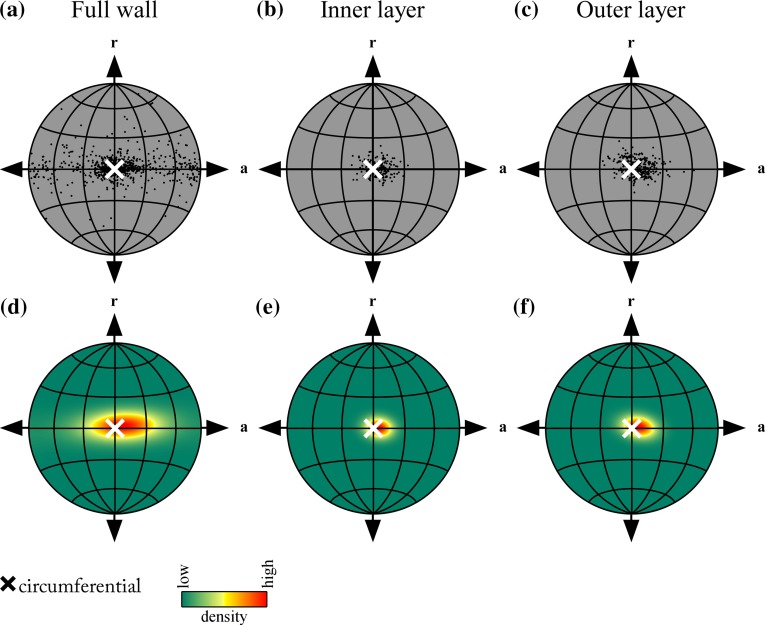
Fig. 5.
Representative examples of orientations of SMC nuclei in the artery wall. Orientations of detected nuclei, visualised using Lambert equal-area projection a before layer separation, b for the inner layer, and c for the outer layer. The Lambert equal-area projection is elaborated on in “Appendix 1”. d–f Corresponding fitted Bingham distributions to orientations in a–c. The obtained Bingham distributions provide a quantification of the distribution of the individual orientations. The distribution parameters are explained in Fig. 6. SMC smooth muscle cell

