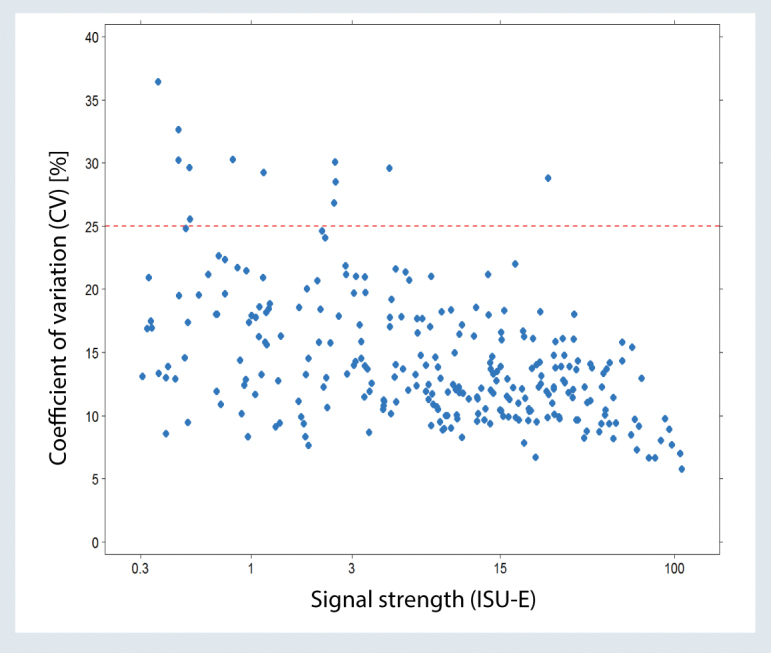
Fig. 2.

Coefficient of variation (CV) depending on signal strength (ISU-E). Four serum samples covering 105 single allergens were used for calculation. Each sample was analyzed in triplicate in a total of 17 runs over a 4-week period. (From [8], with kind permission from Thermo Fisher Scientific, Uppsala, Sweden)
