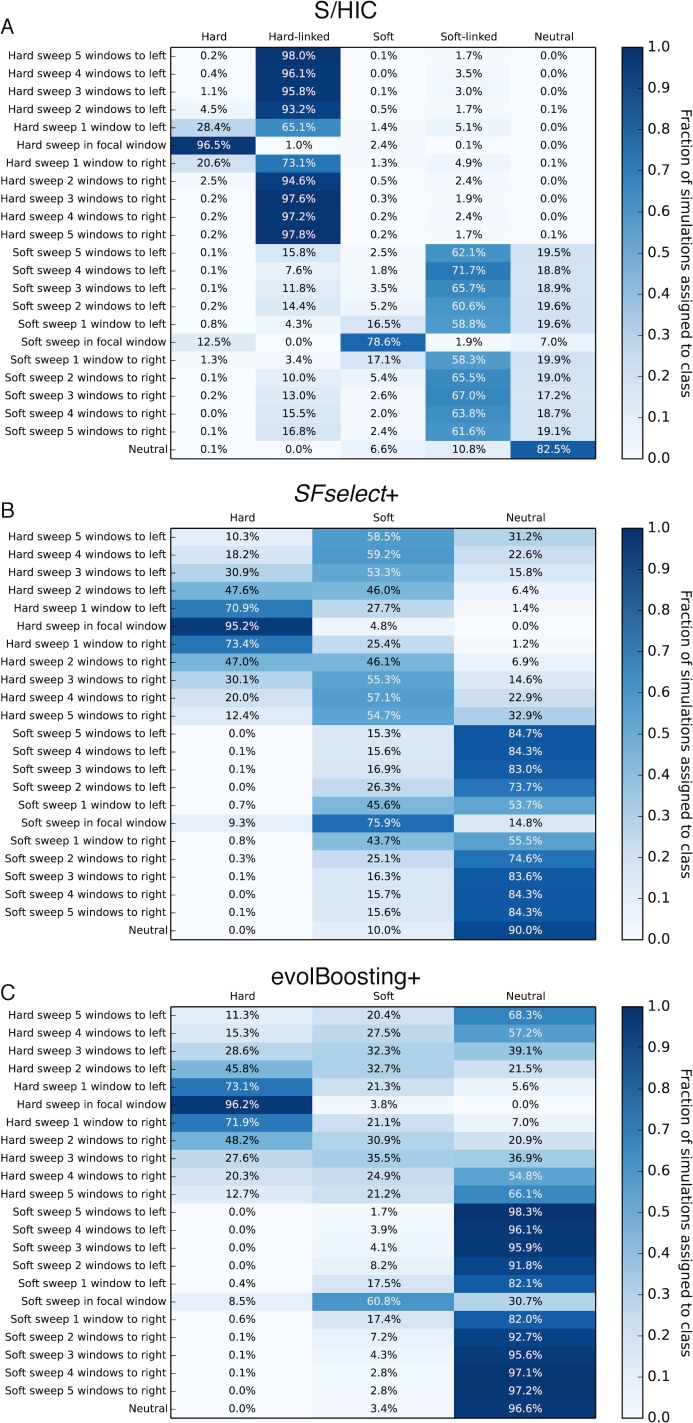
Fig 4. Heatmaps showing the fraction of regions at varying distances from sweeps inferred to belong to each class by S/HIC, SFselect+, and evolBoosting+.
The location of any sweep relative to the classified window (or "Neutral" if there is no sweep) is shown on the y-axis, while the inferred class on the x-axis. Here, α~U(2.5×10², 2.5×10³). A) Results for S/HIC. B) SFselect+. C) evolBoosting+.

