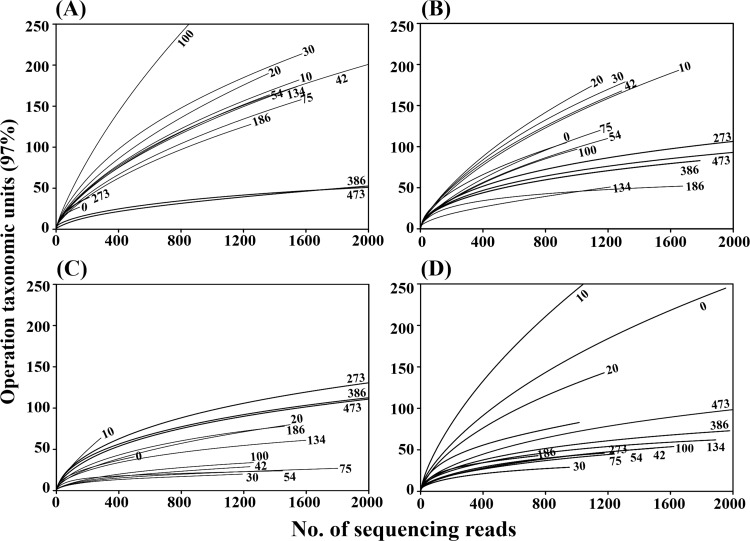
Fig 2.
Rarefaction curves showing the bacterial diversity of MA samples fermented at 15°C (A), 20°C (B), 25°C (C), and 30°C (D). The rarefaction curves were depicted by the RDP pipeline with a 97% OTU (operational taxonomic units) cutoff using 16S rRNA gene sequences. The x- and y-axes indicate the numbers of sequencing reads sampled and the cumulative numbers of OTU recorded, respectively. Numbers beside the curves represent the fermentation time (days).

