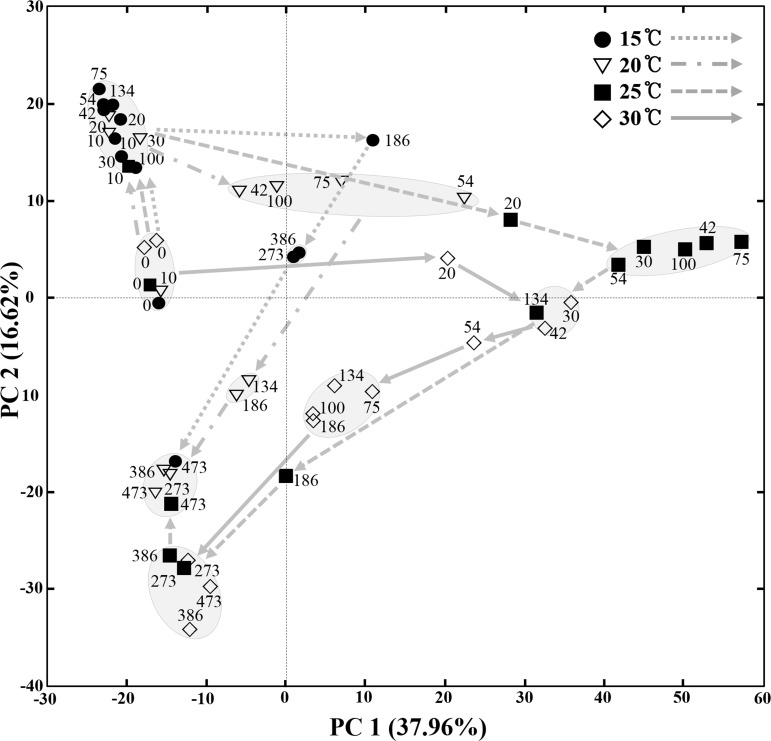
Fig 3. A score plot of principal-component analysis (PCA) showing the bacterial community changes of MA samples incubated at 15°C, 20°C, 25°C, and 30°C during the entire fermentation period.
Numbers beside the symbols represent the fermentation time (days) of MA samples. The curved arrows indicate the routes of the bacterial community changes during the fermentation period in MA samples fermented at different temperatures. The score plot was constructed using weighted OTU information in respective MA samples.

