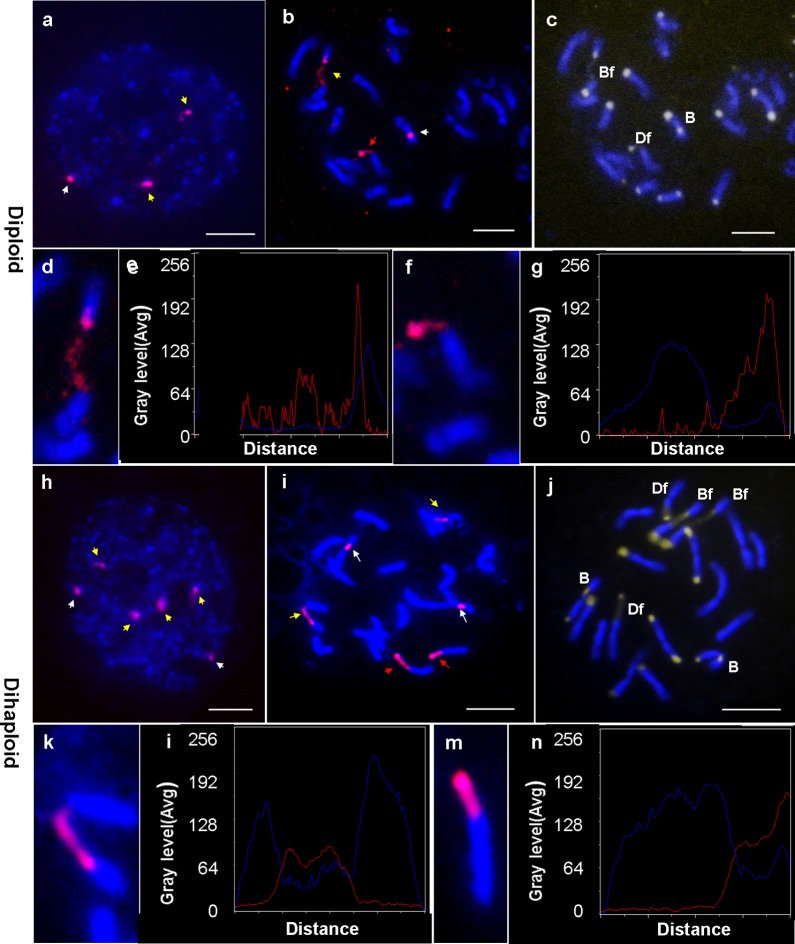
Fig 3. Localization of 45S rDNA by FISH in diploid (a-g) and dihaploid (d-n).
a and h, red hybridization signals of 45S rDNA on interphase nucleus stained by DAPI; b and i, red Cy3 as hybridization signals of 45S rDNA on metaphase chromosomes stained by DAPI; c and j, DAPI and CMA staining chromosomes (B, Bf, D and Df indicate the type of each chromosome); d, f, k and m, enlarged images of chromosome with fragile site; e, g, i and n, linescan curve analysis of fluorescence signals for the chromosomes with 45S signals. The horizontal axis is the length of one chromosome, and the vertical axis is the gray level which measures the intensity of the fluorescent dye and signals. The red line represents the hybridization site and signal intensity, and the blue line shows chromosomes stained by DAPI. The yellow arrows indicate proximal decondensed 45S rDNA loci and the red arrows indicate the subterminal decondensed 45S rDNA loci, while white arrows indicate condensed 45S rDNA loci. Bar scales = 5 μm.

