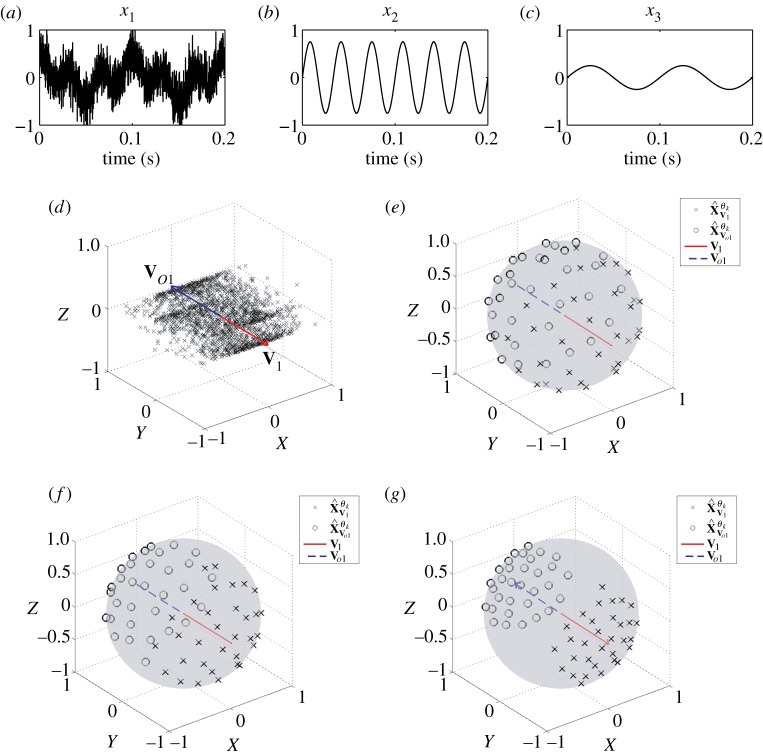
Figure 2.
Input signal to the first sifting operation. (a–c) The three data channels considered. (d) Scatter plot of the trivariate data, first principal component and its diametrically opposite vector. (e–g) Projection vectors adapted according to the proposed scheme using different α values (0, 0.5 and 1, respectively). (Online version in colour.)

